
VanPlex ran PlexRank on 11,389 MF1-zoned properties in Kelowna. Unlike Metro Vancouver — where SSMUH rules created broad eligibility — Kelowna’s land economics create a much narrower viable set. Mean ROE: 4.9%. Median: 15.0%. 2,946 parcels return negative equity. The zoning map says yes. The math says not yet.
Kelowna opened the door to multiplex development across thousands of properties. The City changed the rules. The zoning maps expanded. Politicians pointed to MF1 as the answer to the housing crisis. We ran the numbers on every single eligible property. What we found should change how you think about what zoning reform actually does — and doesn’t — deliver.
TL;DR (Key Takeaways)
- VanPlex modelled 11,389 MF1-zoned parcels in Kelowna using PlexRank
- Mean ROE: 4.9%, Median ROE: 15.0% — tight margins across the board
- 2,946 properties (25.9%) return negative equity — builders would lose money today
- Standard deviation of 36.7% signals wildly uneven opportunity across the city
- Builders confirm the economics: “The cost is too high for what you can sell” (CHBA-CO, March 2026)
- Kelowna’s young housing stock creates a structural cost problem — you’re demolishing value, not clearing land
- Maximizing density doesn’t maximize viability; smaller units with more bedrooms are the path forward
- Zoning permission is not the same as economic opportunity — all three cost levers are working against builders simultaneously
What Is PlexRank and Why Does It Matter?
PlexRank is VanPlex’s citywide feasibility model. For each MF1-zoned parcel in Kelowna, we calculate the return on equity (ROE) a builder would realistically earn if they tore down the existing structure and replaced it with a multiplex today. ROE measures the return on the equity already sitting in a property: the value of the land and home as they stand right now, before any multiplex development begins.
We account for land value, construction costs, financing, absorption rates, and current sale pricing. Every parcel gets a score. The full distribution across most of the 11,389 MF1-zoned properties is what you see in the analysis below.
This isn’t a planning exercise. It’s an investment-grade snapshot of what the market actually looks like on the ground.
What City Hall Is Saying
To be fair to the City of Kelowna, significant effort has gone into removing process-level barriers. Speaking at his State of the City address in September 2025, Mayor Tom Dyas highlighted the progress made on the permit side:
“Our fast-track infill housing program has cut approval times from over a year to less than a month, which means builders can get shovels in the ground sooner and families can move into their homes faster.” — Mayor Tom Dyas, City of Kelowna, State of the City Address, September 2025
Faster approvals are a genuine improvement. But speed of permitting is not the same as economic viability. Our data shows that even with streamlined approvals, the financial case for building on the majority of Kelowna’s MF1 parcels does not close. The bottleneck is not paperwork. It’s the math.
The Headline Number Hides the Real Story
Eleven thousand, three hundred and eighty-nine. That’s the number of MF1-zoned properties in Kelowna. It sounds enormous, and it is, by any planning measure. But raw zoning count is not the same as opportunity.
With a mean ROE of just 4.9% and a median of 15.0%, the distribution tells a story of a market where the math is tight at best, and deeply negative at worst.
2,946 — that’s the number of Kelowna MF1 properties with a negative return on equity, meaning a builder would lose money building today.
The Industry Is Already Sounding the Alarm
VanPlex’s model confirms what builders on the ground have been saying publicly for months. In March 2026, Cassidy DeVeer, Executive Officer of the Canadian Home Builders’ Association Central Okanagan (CHBA-CO), put it in the clearest possible terms:
“The cost is too high for what you can sell.” — Cassidy DeVeer, Executive Officer, CHBA Central Okanagan, March 2026
DeVeer and CHBA-CO President Krista Paine wrote directly to Kelowna City Council in early 2026, warning that the cumulative effect of escalating fees, off-site requirements, and servicing constraints has effectively eliminated an entire segment of attainable home building in the city.
“Residential construction helped carry Kelowna through crisis, and now we are being left in the dark to quietly erode.” — Cassidy DeVeer, Executive Officer, CHBA Central Okanagan, March 2026
Kelowna’s Youth as a City Is a Structural Constraint
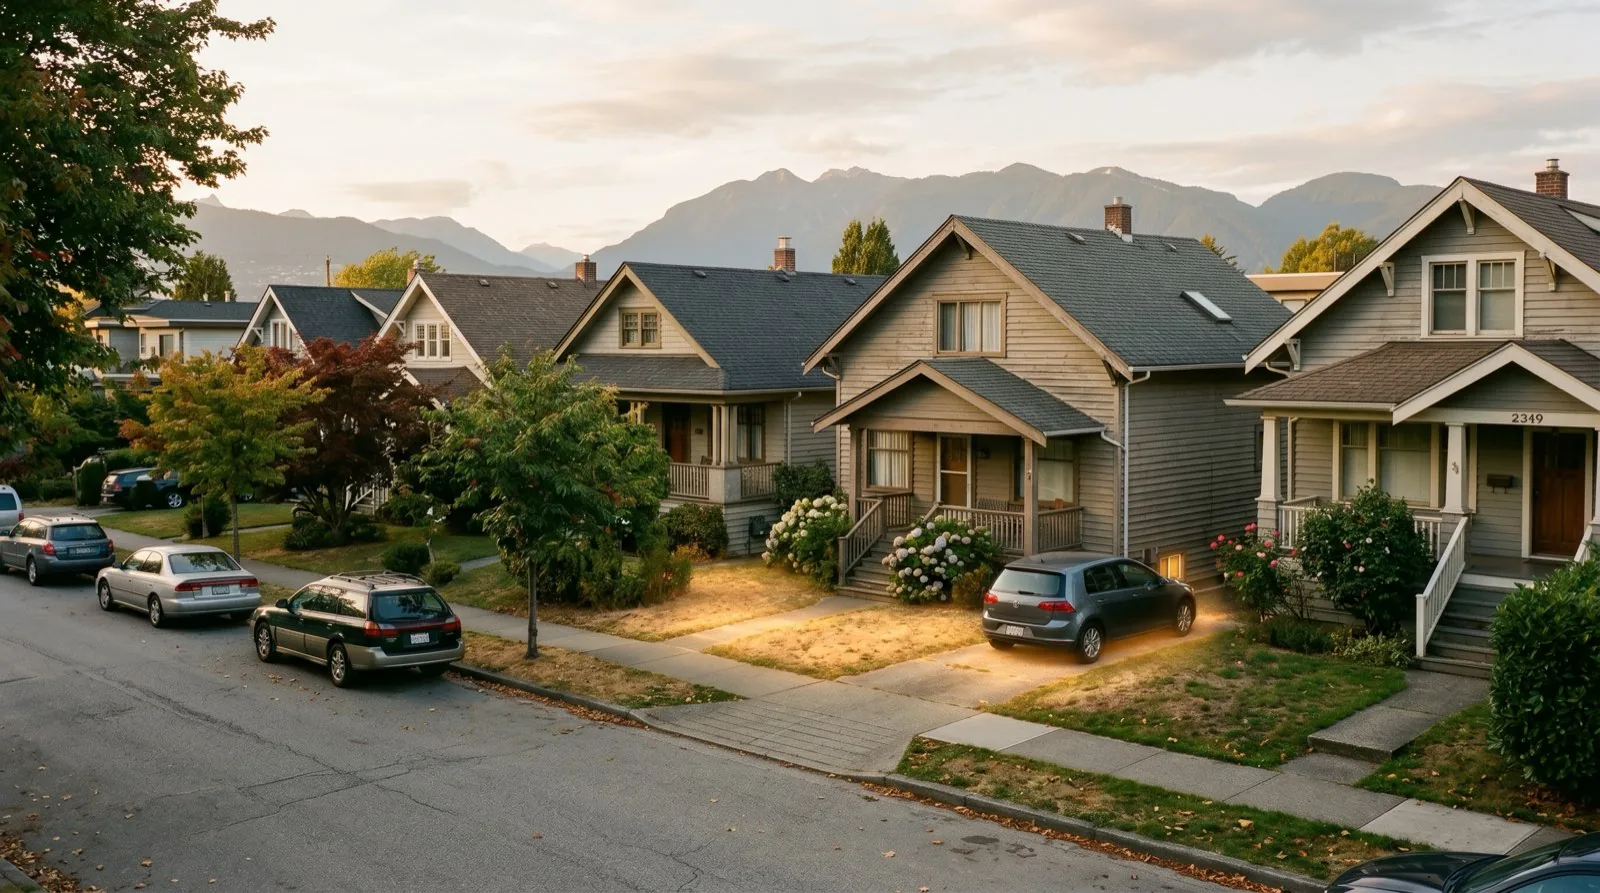
Unlike older cities where homes have aged past their useful life and land value dominates, Kelowna is a relatively young city. Thousands of MF1-zoned properties have homes built within the last 10 to 20 years — homes with significant remaining value.
When you buy a property worth $1,000,000 and $500,000 of that is the house itself, you have to demolish half your purchase before breaking ground. You’re not buying land. You’re buying land with an expensive obstacle on top of it.
“Kelowna’s a fairly young city. So the availability of lots that you could purchase at the right price and also feel good, taking the house down and replacing it with a multi-unit complex — there aren’t as many. It is a smaller pool at the end of the day.” — Aaron Whalen, SNDBOX, Kelowna-based multiplex builder
Add irregular lot shapes and significant topography. Kelowna’s hills and slopes eliminate many parcels that look eligible on a zoning map, and the buildable pool shrinks further still.
36.7% — that’s the standard deviation in Kelowna’s ROE distribution, a reflection of just how uneven opportunity is across the city, even within the same zoning class.
Density and Affordability Are Pulling in Opposite Directions
One of the more counterintuitive findings from our work is that maximizing density doesn’t automatically maximize viability — or affordability. Builders who pushed unit sizes up found that the resulting sale prices pushed buyers out of reach.
The builders finding a path forward are designing down in size, not up. Smaller footprints, fewer square feet per unit, but more bedrooms per building.
“The density was fighting against the sellable price point of the units and the livability factor. We actually reverse engineered it — we looked at what is the attainable price point we need to achieve for a young family or a young professional couple or a downsizer.” — Aaron Whalen, SNDBOX
The result? Six three-bedroom units with private garages at 1,000 square feet each. More bedrooms per dollar. Less cost to build. A product that fits the market, but one that demands creative problem-solving at every stage.
| Metric | Value |
|---|---|
| MF1-Zoned Parcels Analyzed | 11,389 |
| Mean ROE | 4.9% |
| Median ROE | 15.0% |
| Negative ROE Parcels | 2,946 (25.9%) |
| Standard Deviation | 36.7% |
| Viable Design Template | 6 units, 3-bed, 1,000 sqft each |
Zoning Permission Is Not Economic Opportunity
The central finding of VanPlex’s Kelowna Phase One analysis is straightforward: the fact that your property is zoned MF1 does not mean that building a multiplex on it is financially viable today.
Zoning reform is necessary. It removes a legal barrier. But it cannot, on its own, address the structural cost-price imbalance that defines this market.
There are three levers that determine whether a multiplex project makes sense on a given property: the cost of land, the cost to build, and the price a buyer or renter can pay. Our investment resources walk through how to evaluate these levers on any property you’re considering. The good news is that any one of these levers moving significantly can change the picture. Land doesn’t need to be cheap, construction doesn’t need to collapse, and prices don’t need to spike — if one of them shifts enough to tip a marginal project into viable territory.
What our data shows is that right now, all three are working against the builder at the same time. And that’s the harder problem to solve.
It’s also worth noting what counted as housing progress last year. The City of Kelowna reported completing nearly 3,500 homes in 2024, meeting its provincial targets on paper. But the bulk of those completions were condominiums, including many small units — not the kind of ground-oriented family homes that MF1 zoning was designed to produce. Hitting a numerical target and actually housing families in neighbourhoods are not always the same thing.
Until the economics of neighbourhood-scale housing improve, zoning maps and real-world housing delivery will continue to tell very different stories.
“And here is what is most concerning: The desire for home ownership has not disappeared.” — Cassidy DeVeer and Krista Paine (President), CHBA Central Okanagan, Letter to Kelowna City Council, March 2026
“Both the land value and construction costs went up at the same time. The numbers at the end of the day are a struggle to balance.” — Aaron Whalen, SNDBOX
Demand has not gone away. What’s gone away is the economic pathway to meeting it. That’s the gap our model documents — at scale, parcel by parcel, across an entire city.
This Is a Living Dataset
PlexRank is updated quarterly. As market conditions shift — including interest rates, construction costs, and sale prices — the distribution changes. We will track all of it and report here, in plain language, with the data front and centre.
If you own an MF1-zoned property in Kelowna and want to understand where your specific parcel sits in this distribution, reach out to us directly at [email protected] or use the advanced proforma calculator to run the numbers on your lot.
David Babakaiff, CEO and Co-Founder of VanPlex PlexRank | Profit with Multiplex
VanPlex Analytics is Canada’s leading multiplex investment platform. PlexRank is updated quarterly across Kelowna, Vancouver, and Burnaby. Quotes from Cassidy DeVeer and Mayor Tom Dyas are sourced from published media.