
Most games are designed to be fair. Ten players, ten roughly equal chances. Wins spread around the table over time. Poker with strangers on a first hand works roughly like that. Game theory calls this a normal distribution. Most real estate investors and developers assume this is the game they’re in.
It’s not.
TL;DR (Key Takeaways)
- PlexRank has analyzed over 100,000 GVRD properties for multiplex feasibility
- Only 2,419 properties (roughly 2%) show a return on equity of 100% or better
- The other 98% don’t pencil, barely pencil, or fall apart under real-world risk
- Most developers work outside-in (pick a neighbourhood, find a lot). That approach lands in viable territory about 2% of the time
- VanPlex works inside-out: identify the 2% first, then reverse-engineer the deal
- The edge in multiplex development isn’t hustle or construction efficiency — it’s knowing which lots to invest in
What a power law actually is
When one player at the table can see cards the others can’t, the wins stop spreading. They concentrate. The informed player doesn’t win slightly more often — they win at a rate completely disproportionate to their numbers. That’s a power law. A small percentage of players capturing an outsized share of outcomes because they were playing a different game than everyone else thought was being played.
This isn’t abstract theory. It shows up in venture capital (a handful of deals return all the fund’s profits), in real estate (a few blocks drive most of a city’s appreciation), and now in Vancouver’s multiplex zoning data.
What the multiplex data actually shows
PlexRank has now analyzed over 100,000 GVRD properties across Vancouver and surrounding municipalities.
Of those, roughly 2,419 show a return on equity of 100% or better. That’s about 2% of the multiplex-eligible properties. The rest either don’t pencil, barely pencil, or the math only works on paper until you add real risk — what if the sales price when it’s finished in the future is less than today?
That’s the power law showing up in zoning data.
| Category | Properties | Share | What it means |
|---|---|---|---|
| 100%+ ROE | ~2,419 | ~2% | Strong risk-adjusted returns |
| Marginal or break-even | ~48,000 | ~48% | Works on paper, fragile under stress |
| Doesn’t pencil | ~50,000 | ~50% | Negative or negligible returns |
The distribution isn’t a bell curve. It’s a cliff. A tiny fraction of lots carry the vast majority of the viable opportunity.
Why the standard approach misses
Most developers I know work from the outside in. They start with a neighbourhood they like, find a lot, run the numbers, and go from there.
Our data says that approach lands in viable territory roughly 2% of the time. The other 98% don’t know they missed the lowest-risk, best-return properties before the first meeting with an architect.
Think about what that means practically. A developer who picks a neighbourhood first and then hunts for a lot is essentially playing a game where they have a 2% chance of finding the best deals. They might find something that pencils — barely — but they’re almost certainly not finding the lots where the risk-adjusted math is strongest.
Working the problem backwards
We work the opposite direction. PlexRank identifies the 2% first. The investment overview covers how professional capital is using this kind of data to build disciplined deal flow. Then we reverse-engineer the deal structure, the capital stack, and the timeline backward from the outcome.
What this means practically: the edge in multiplex development isn’t hustle or relationships or even construction efficiency. It’s asymmetrical knowledge of which lots to invest in.
That’s what we’ve been building.
How PlexRank finds the 2%
The algorithm scores every residential property across multiple variables: lot dimensions, zoning capacity, current assessed value vs. post-development value, construction cost estimates, neighbourhood sale comps, and risk-adjusted return projections. Properties that clear the threshold on all dimensions — not just one or two — make it into the top tier.
It’s the difference between “this lot is zoned for 4 units” (true for tens of thousands of lots) and “this lot is zoned for 4 units AND the math works AND the risk profile is strong AND the neighbourhood supports the end-product pricing.” That second filter is where the 100,000 becomes 2,419.
From the field this week
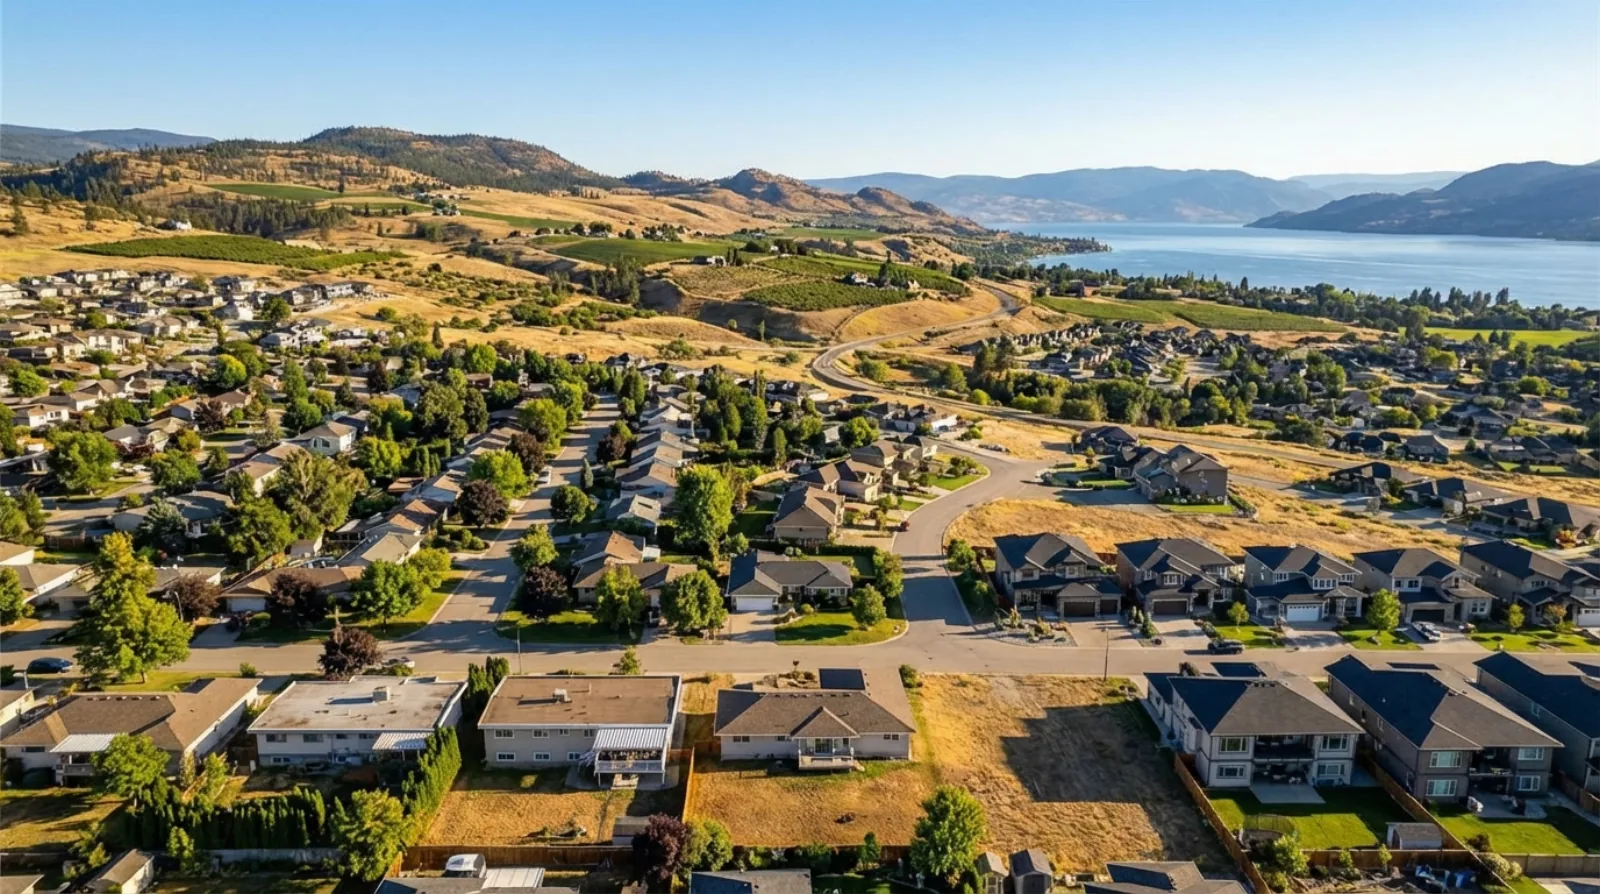
VanPlex is extending into North Vancouver and Kelowna over the next 90 days. Both markets show different versions of the same problem: homeowners sitting on rezoned land they don’t fully understand yet. We’re building the same PlexRank data layer for both cities that we built for Vancouver — discovering the power law in those markets.
We also have a federal grant application on the desk right now for a mass timber multiplex project in Vancouver. Deadline March 27. More on what we’re building there once it’s submitted.
What this means for you
If you own property in Metro Vancouver, one of two things is true:
- Your lot is in the 2%. The math works, the risk profile is manageable, and a multiplex development could meaningfully change your financial position.
- Your lot is in the 98%. That doesn’t mean it’s a bad property — it means multiplex development isn’t the right play for it right now.
Either way, you should know which side you’re on before you spend $20K on architectural drawings. The advanced proforma calculator lets you model the numbers yourself before engaging any professionals.
Visit VanPlex.ca and enter your address. You’ll see your property’s PlexRank score and where it falls in the distribution. Two minutes. No cost. No sales pitch — just the data.
David Babakaiff
CEO & Co-Founder, VanPlex
PlexRank(TM) | Profit with Multiplex