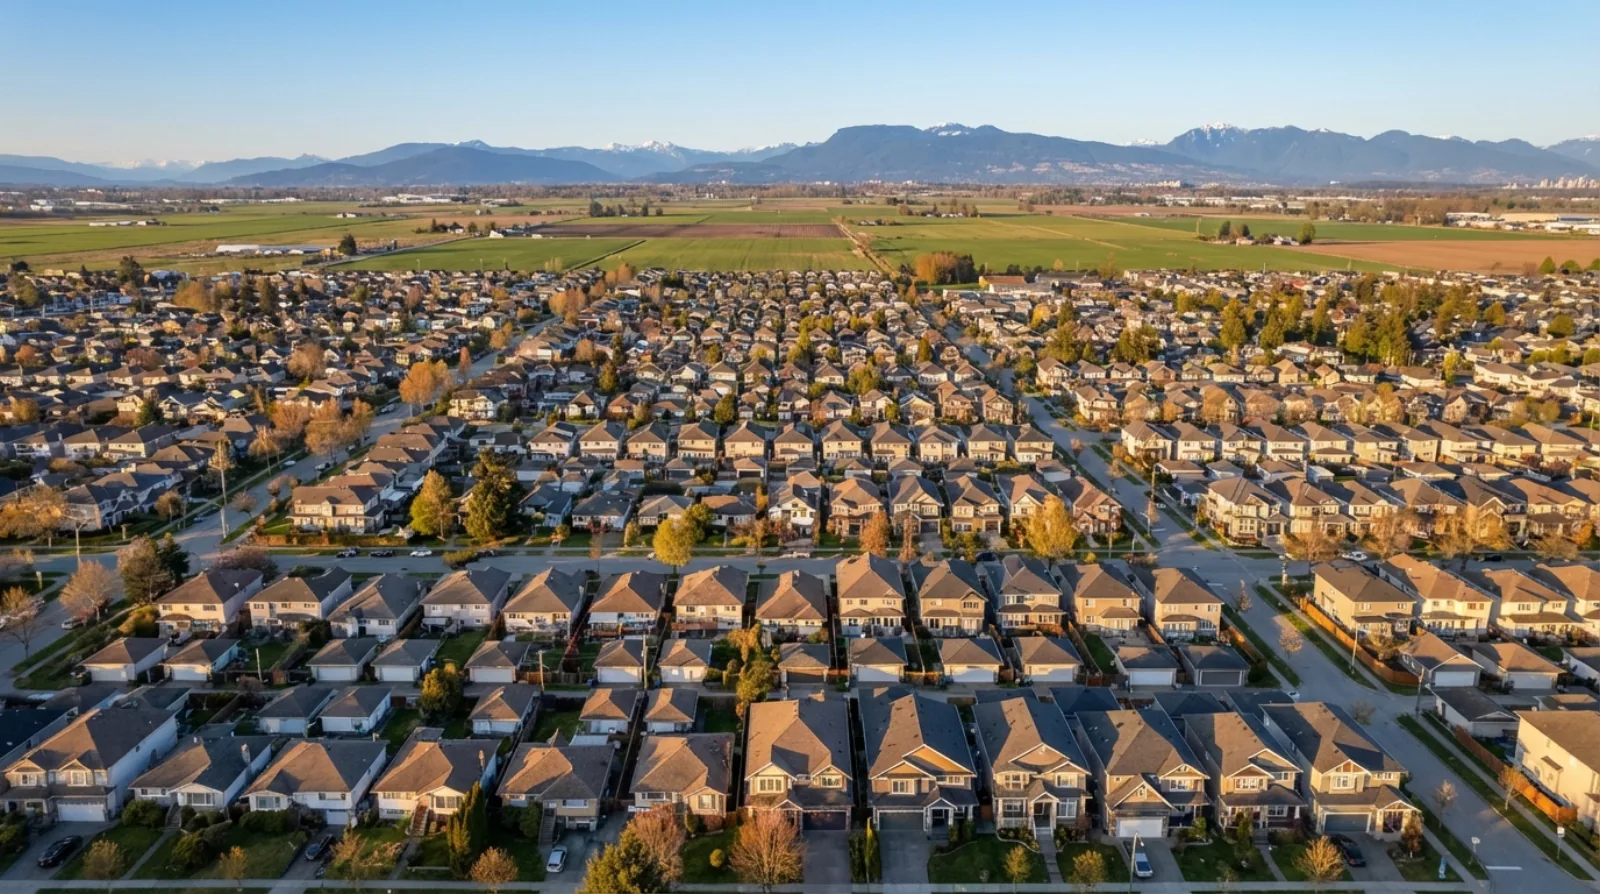

VanPlex ran pro formas on 11,606 Kelowna properties using actual GIS lot sizes, BC Assessment land values, and comparable sales data. The PlexRank results are clear: mean ROE of 4.9%, 25.4% of lots produce negative returns, and zero lots hit 100%+ ROE. Kelowna is the weakest multiplex market we’ve analyzed in BC — and the data explains exactly why.
TL;DR: Most Kelowna Lots Fail the Pro Forma
- 11,606 pro formas run — VanPlex PlexRank analysis on every linked Kelowna property
- Mean ROE: 4.9% | Median ROE: 15.0% — the mean is dragged down by 2,951 negative-ROE lots
- 25.4% produce negative ROE — you lose money on one in four lots
- Only 18.2% hit 20%+ ROE — the minimum threshold for serious development consideration
- Zero lots reach 100% ROE — the benchmark that makes Vancouver/Burnaby deals compelling
- 78.8% have existing homes worth more than half their land value — you’re demolishing real value
- $570/sqft sales vs $365/sqft build = only 36% gross margin (vs 47% in Vancouver/Richmond)
- 2,496 lots already have suites generating income — owners have little incentive to demolish
The PlexRank Data: 11,606 Pro Formas
We didn’t estimate. We ran every property through VanPlex’s pro forma engine using actual lot sizes from Kelowna GIS, BC Assessment land and improvement values, and comparable sales data. Here’s what 11,606 pro formas look like:
PlexRank ROE Distribution
| ROE Range | Lots | Share | What It Means |
|---|---|---|---|
| Below 0% (negative) | 2,951 | 25.4% | You lose money — property cost exceeds development upside |
| 0% to 10% | 732 | 6.3% | Technically positive but below GIC returns |
| 10% to 20% | 5,812 | 50.1% | Marginal — thin margin for risk taken |
| 20% to 30% | 2,033 | 17.5% | Viable — minimum threshold for development |
| 30% to 50% | 76 | 0.7% | Good deal — worth pursuing |
| 50%+ | 2 | 0.02% | Outlier — unusual lot characteristics |
| 100%+ | 0 | 0% | Does not exist in Kelowna |
Half of all Kelowna lots (50.1%) land in the 10-20% ROE band. That’s technically positive but nowhere near enough to justify the risk of a $3-7M construction project over 18-24 months. Only 2,111 lots (18.2%) hit 20%+ ROE — the minimum threshold where developers start to pay attention.
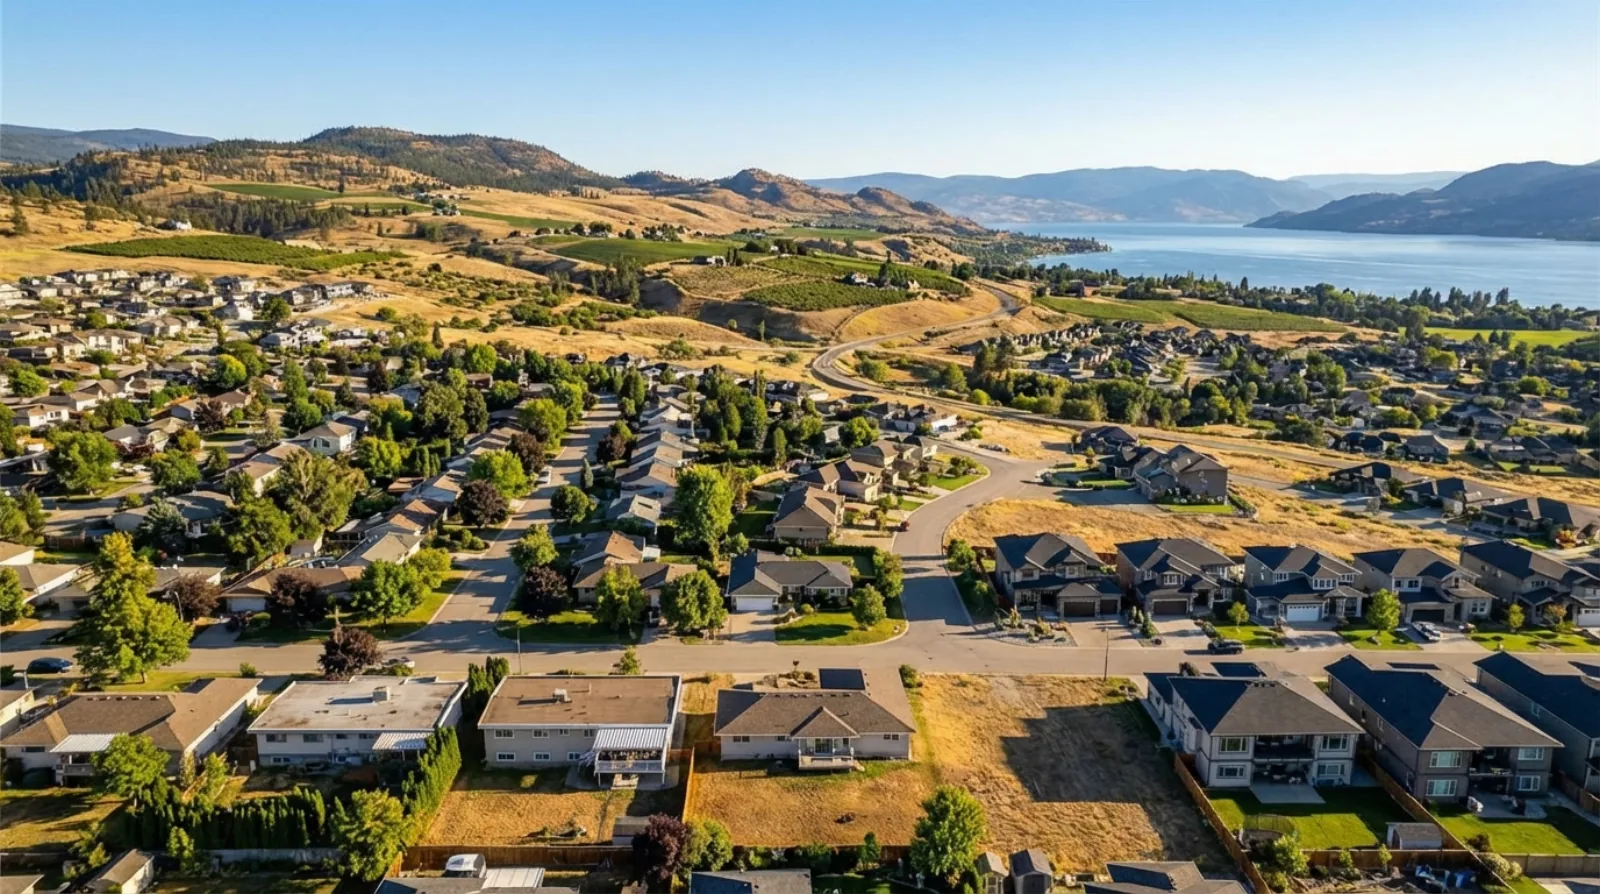
Problem 1: You’re Demolishing $438K Homes
The average qualifying lot in Kelowna has a $438K improvement value sitting on $507K of land. That’s an improvement-to-land ratio of 86%. In Vancouver, that ratio is closer to 30-40% — the land dwarfs the structure, making demolition economically rational.
| Metric | Kelowna | Vancouver | Why It Matters |
|---|---|---|---|
| Avg land value | $507K | $2.8M+ | Lower land = less incentive to redevelop |
| Avg improvement value | $438K | $800K-1M | Kelowna improvements are proportionally huge |
| Improvement/Land ratio | 86% | 30-40% | Demolishing 86% of land value is irrational |
| Total assessment | $945K | $3.5M+ | You’re buying a $945K property to tear down |
4,915 lots (33.5%) have improvement value exceeding land value. On these properties, the house is literally worth more than the land beneath it. Demolishing to build a multiplex means destroying the most valuable part of the asset. Another 6,643 lots (45.3%) have improvements worth 50-100% of land value. Combined, 78.8% of qualifying lots have structures too valuable to rationally demolish.
The Improvement Problem by the Numbers
| Improvement vs Land | Lots | Share | Demolition Logic |
|---|---|---|---|
| Improvement exceeds land value | 4,915 | 33.5% | Irrational — destroying the valuable asset |
| Improvement is 50-100% of land | 6,643 | 45.3% | Marginal — significant value destruction |
| Improvement is 25-50% of land | 2,186 | 14.9% | Possible — if margins are strong |
| Improvement under 25% of land | 912 | 6.2% | Rational — land value dominates |
Only 912 lots (6.2%) have the improvement-to-land ratio that makes demolition economically rational. And even those need the rest of the pro forma to produce positive returns.
Problem 2: Three Real Pro Formas — From the Database
These aren’t estimates. These are actual VanPlex pro formas pulled from our database, using real lot sizes, real assessment values, and real comparable sales at $570/sqft.
Negative ROE: A Typical MF1 Lot (-28% ROE)
Assessed at $1.59M ($555K land, $1.03M improvement). Improvement-to-land ratio: 186%. You’re buying a million-dollar house to demolish on $555K of land.
| Line Item | Amount |
|---|---|
| Purchase price (assessment) | $1,589,000 |
| Lot: 5,662 sqft | Zone: MF1 | Units: 6 | |
| Buildable GFA | 8,408 sqft |
| Construction ($365/sqft) | $3,306,920 |
| Interest + placement | $210,650 |
| Sales (8,408 sqft x $570) | $4,792,440 |
| Commission (3%) | $143,773 |
| PlexRank ROE | -28% |
The $1.59M purchase price kills it. The land is worth $555K — but the house sitting on it is worth $1.03M. You’re paying 186% more than the land value just to demolish the structure. The development upside can’t overcome that. This is what 2,951 Kelowna lots look like.
Median ROE: A Typical Mid-Range Lot (15% ROE)
The median Kelowna lot. Assessed at $789K ($470K land, $319K improvement). Improvement-to-land ratio: 68%.
| Line Item | Amount |
|---|---|
| Purchase price (assessment) | $789,000 |
| Lot: 10,021 sqft | Zone: MF1 | Units: 6 | |
| Buildable GFA | 7,059 sqft |
| Construction ($365/sqft) | $2,809,523 |
| Interest + placement | $178,890 |
| Sales (7,059 sqft x $570) | $4,023,900 |
| Commission (3%) | $120,717 |
| PlexRank ROE | 15% |
15% ROE is the median Kelowna lot. Half do worse. It’s technically positive, but 15% on a $3.8M project over 18-24 months, with construction risk, permitting delays, and market uncertainty? A GIC pays 4% risk-free. You need 20%+ ROE to justify this level of risk.
Good ROE: A Large MF1 Lot (25% ROE)
Large lot, low improvement value relative to land. Assessed at $1.29M ($1.12M land, $166K improvement). Improvement-to-land ratio: 15%.
| Line Item | Amount |
|---|---|
| Purchase price (assessment) | $1,286,000 |
| Lot: 27,007 sqft | Zone: MF1 | Units: 6 | |
| Buildable GFA | 11,506 sqft |
| Construction ($365/sqft) | $4,449,972 |
| Interest + placement | $302,121 |
| Sales (11,506 sqft x $570) | $6,558,600 |
| Commission (3%) | $196,758 |
| PlexRank ROE | 25% |
What makes this one work? Large lot (27,007 sqft) with only 15% improvement-to-land ratio — the structure is worth $166K, not $1M. The lot generates 11,506 sqft of sellable GFA, spreading the purchase cost over more revenue. Only 2,111 lots (18.2%) in Kelowna achieve this 20%+ ROE threshold.
The Pattern: Purchase Price Is the Variable
All three lots sell at $570/sqft and build at $365/sqft. The margin is identical. What separates a -28% ROE from a 25% ROE is the purchase price relative to the lot’s development potential. Expensive homes on moderate lots produce negative returns. Moderate homes on large lots produce viable returns.
| Metric | Vancouver | Richmond | Coquitlam | Kelowna |
|---|---|---|---|---|
| Sales/sqft | varies | $800 | $700 | $570 |
| Build/sqft | $425 | $425 | $425 | $365 |
| Gross margin on build | 47%+ | 47% | 39% | 36% |
| Avg purchase price | $3.5M+ | $1.71M | $1.43M | $945K |
| Interest rate | 5-7% | 5-7% | 5-7% | 9.5% |
| Error margin | Forgiving | Forgiving | Moderate | Razor-thin |
Kelowna’s 9.5% interest rate (vs 5-7% in Metro Vancouver) is particularly punishing. On a $3.7M construction loan drawn over 18 months, the interest differential alone costs $80-100K more than a coastal project.
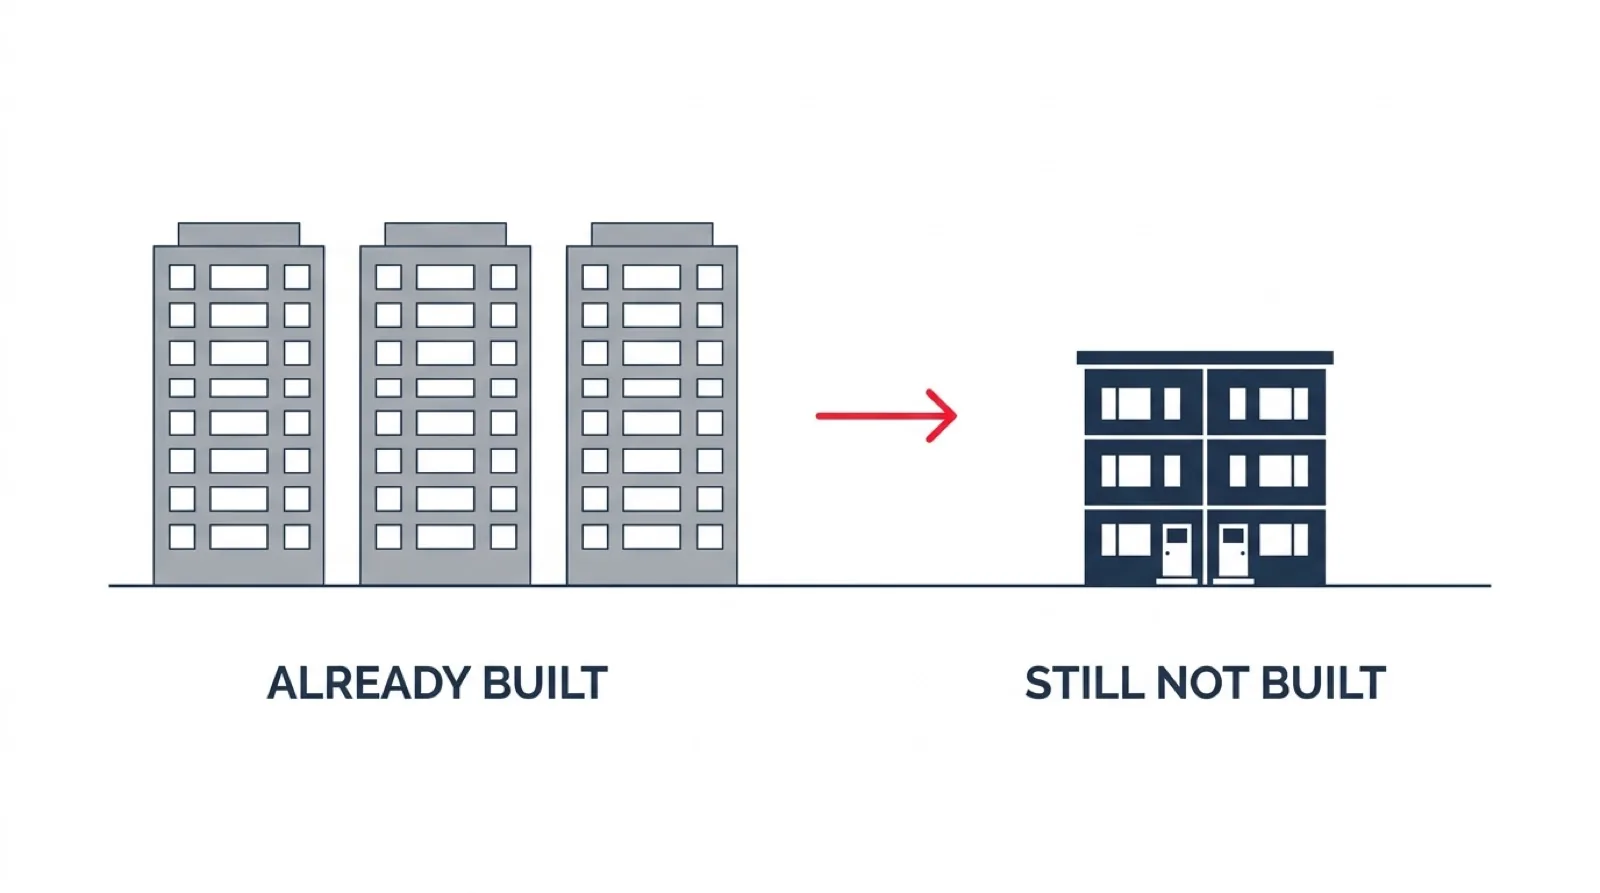
Problem 3: The 2,496 Suite Owners Won’t Demolish
17% of qualifying lots (2,496) already have rental suites. These homeowners are generating $1,500-2,500/month in supplementary income with zero development risk, zero construction debt, and zero vacancy period. Why would they demolish a functioning cash-flow asset to take on $6M in project risk?
| Current Situation | Monthly Income | Risk | Capital Required |
|---|---|---|---|
| Home + suite (status quo) | $1,500-2,500 | Zero | Zero |
| Multiplex development | $0 for 18-24 months | Extreme | $2.5M equity |
The suite owners are the last people who will convert. They’ve already optimized their situation.
Problem 4: 2,131 Lots Are Too Small
14.5% of qualifying lots (2,131) are under 5,000 sqft. At Kelowna’s 40-55% coverage ratio, a 4,500 sqft lot produces:
- Suburban (RU): 4,500 x 0.40 = 1,800 sqft footprint x 2.2 storeys = 3,960 sqft GFA
- MF1: 4,500 x 0.55 = 2,475 sqft footprint x 2.7 storeys = 6,683 sqft GFA
Even the MF1 number is misleading — 6,683 sqft across 6 units is 1,114 sqft per unit. These are small 2-bedroom apartments, not family-sized units. At $570/sqft, that’s $635K per unit. In a market where you can buy a detached home with a suite for $800K-1M, the value proposition is thin.
680 lots are under 4,000 sqft. On these lots, building 4-6 units produces micro-units that are hard to sell at $570/sqft. The buyer is choosing between a 900 sqft multiplex unit at $513K and a 2,000 sqft townhouse at $700K. The townhouse wins every time.
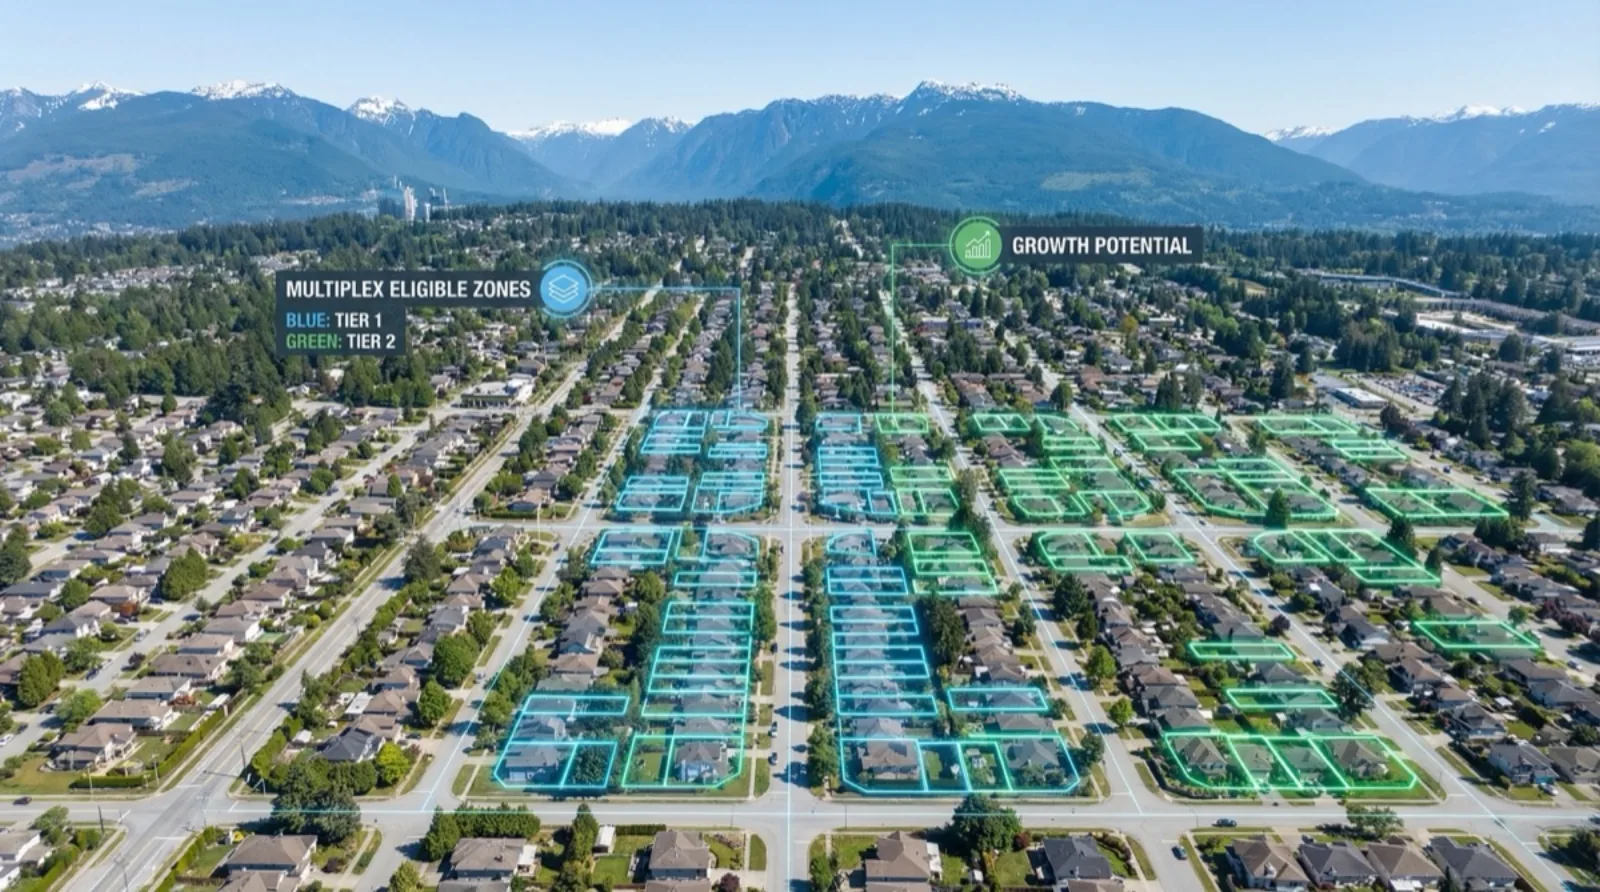
Where It Actually Works: The 2,111 Lots at 20%+ ROE
PlexRank identifies 2,111 lots (18.2%) that achieve 20%+ ROE — the minimum threshold where development risk starts to make sense. Here’s how the funnel breaks down:
| Filter | Lots | Share |
|---|---|---|
| Pro formas run | 11,606 | 100% |
| Negative ROE (lose money) | 2,951 | 25.4% |
| 0-10% ROE (below GIC returns) | 732 | 6.3% |
| 10-20% ROE (marginal for this risk) | 5,812 | 50.1% |
| 20%+ ROE (viable) | 2,111 | 18.2% |
| 30%+ ROE (strong deal) | 78 | 0.7% |
What separates the 2,111 viable lots from the 9,495 that fail? Three factors:
1. Lower purchase price relative to lot size — properties where the existing structure doesn’t inflate the cost beyond what the development can recover. The 25% ROE example has a 27,007 sqft lot for $1.29M. The -28% ROE example has a 5,662 sqft lot for $1.59M.
2. Larger lots generating more sellable GFA — more square footage to sell at $570/sqft spreads the fixed purchase cost over more revenue. Lots above 10,000 sqft disproportionately appear in the 20%+ tier.
3. Lower improvement-to-land ratios — the closer to 100%+ the improvement ratio, the more you’re paying for a structure you’ll demolish. The negative-ROE examples average 150%+ improvement ratios.
Zone-by-Zone Breakdown
For reference, here’s the full qualifying zone data:
| Zone | Purpose | Lots | Avg Lot (sqft) | Avg Land Value | Max Units |
|---|---|---|---|---|---|
| MF1 | Infill Housing | 11,663 | 8,727 | $527,396 | 6 |
| RU2 | Suburban | 2,837 | 10,446 | $434,221 | 4 |
| RU3 | Suburban | 151 | 7,713 | $399,689 | 4 |
| RU5 | Rural-Urban | 5 | 1,940,748 | $1,345,333 | 4 |
| Total | 14,656 | 9,708 | $507,307 |
Zone Distribution Visual
Kelowna’s Coverage-Based Zoning Model
Kelowna uses a coverage-based system under Bylaw 12375, not FSR:
| Parameter | Suburban (RU) | Infill (MF1) | Transit (TOA) |
|---|---|---|---|
| Max units | 4 | 6 | 6 |
| Max storeys | 2.5 | 3 | 6 |
| Max height | 9.5m | 11m | 18m |
| Coverage | 40% | 55% | 60% |
| Parking/unit | 1.25 | 1.0 | 0.0 |
MF1 lots (79.6% of qualifying) can theoretically build 6 units. But “can” and “should” are different questions. The 55% coverage and 3-storey limit produce adequate GFA on lots above 7,000 sqft. Below that, the units get too small to compete with existing housing stock.
Land Value Distribution
| Value Range | Lots | Share | Viability |
|---|---|---|---|
| Under $300K | 433 | 3.0% | Potentially viable |
| $300K - $500K | 7,770 | 53.0% | Viable if low improvement |
| $500K - $750K | 5,317 | 36.3% | Marginal — needs strong sales |
| $750K - $1M | 174 | 1.2% | Unlikely viable |
| $1M - $1.5M | 81 | 0.6% | Not viable |
| $1.5M+ | 881 | 6.0% | Not viable |
The $300-500K band (53% of lots) sounds promising — until you add the improvement value. These lots have an average total assessment of $850K-1.1M. You’re not buying $400K land; you’re buying a $950K property and then paying $35K to demolish the house. The effective land cost is whatever someone will sell a functioning home for — usually above assessment.
Lot Size Distribution
| Size Range | Lots | Share | Build Economics |
|---|---|---|---|
| Under 3,014 sqft | 120 | 0.8% | Too small — 3 unit cap, micro-units |
| 3,014 - 5,000 sqft | 2,011 | 13.7% | Marginal — units under 1,200 sqft |
| 5,000 - 7,500 sqft | 4,865 | 33.2% | Moderate — viable in MF1 only |
| 7,500 - 10,000 sqft | 4,844 | 33.1% | Good — adequate GFA for 4-6 units |
| 10,000 - 15,000 sqft | 2,129 | 14.5% | Strong — but land cost rises |
| 15,000+ sqft | 687 | 4.7% | Premium lots — high land cost |
Current Use: What’s On These Lots
| Current Use | Lots | Share | Redevelopment Barrier |
|---|---|---|---|
| Single Family Dwelling | 10,472 | 71.4% | High improvement value |
| Dwelling with Suite | 2,496 | 17.0% | Already generating income |
| Unknown/Other | 743 | 5.1% | Needs investigation |
| Duplex | 486 | 3.3% | Already partially densified |
| Vacant Residential | 260 | 1.8% | None — no demolition cost |
| Fourplex | 25 | 0.2% | Already at density |
| Manufactured Home | 20 | 0.1% | Low improvement — viable |
Government Charges: Per-Unit Formula
Kelowna uses a formula-based DCC:
DCC total = (units x $28,500) + (units x $5,200) + $3,070 + (GFA sqm x 42)For a 6-unit MF1 at 1,100 sqm GFA:
- Base: 6 x $28,500 = $171,000
- Additional: 6 x $5,200 = $31,200
- Fixed: $3,070
- GFA: 1,100 x 42 = $46,200
- Total: $251,470 ($41,912/unit)
Not as cheap as Richmond’s per-lot model ($10,628/unit for 6 units), but significantly less than Vancouver’s $82K/unit or Coquitlam’s $88K/unit.
The Five-City Comparison
| Metric | Vancouver | Coquitlam | Richmond | Kelowna | N. Vancouver |
|---|---|---|---|---|---|
| Qualifying lots | ~56,000 | 22,131 | 25,895 | 14,656 | ~1,940 |
| 20%+ ROE (PlexRank) | ~3,200 | ~1,500 | ~2,000 | 2,111 | ~400 |
| Avg land value | $2.8M+ | $1.43M | $1.71M | $507K | $1.8M |
| Improvement/land ratio | 30-40% | ~50% | ~45% | 86% | ~55% |
| Sales/sqft | varies | $700 | $800 | $570 | $1,050 |
| Build/sqft | $425 | $425 | $425 | $365 | $425 |
| Gross margin on build | 47%+ | 39% | 47% | 36% | 60% |
| Construction financing | 5-7% | 5-7% | 5-7% | 9.5% | 5-7% |
What Would Have to Change
For Kelowna multiplex to make broad economic sense, you’d need one or more of:
- Sales prices to reach $700+/sqft — closing the gap with Coquitlam. At current trajectory, this is 3-5 years away.
- Interest rates to drop to 5-6% — saving $80-100K per project on financing. The Bank of Canada would need to cut significantly.
- Land values to decouple from improvement values — as Kelowna grows and land becomes scarce, the ratio should shift toward land. This is happening slowly.
- Construction costs to stabilize — $365/sqft only works if it stays there. Material inflation erodes the already-thin margin.
Until at least two of these conditions are met, Kelowna multiplex development will remain a niche play for specialists who can identify the 2,111 lots that clear the 20% ROE threshold — not a broad market opportunity.
Top Streets: Where to Look (If You’re Looking)
For the deal-hunters, these streets have the highest concentration of qualifying lots with below-average land values:
| Street | Lots | Avg Lot (sqft) | Avg Land Value | Opportunity |
|---|---|---|---|---|
| Glenmeadows Rd | 169 | 6,494 | $317,455 | Lowest avg land of high-count streets |
| Hollywood Rd N | 122 | 8,173 | $333,449 | Good lot sizes + low land |
| Tower Ranch Dr | 108 | 7,995 | $359,944 | Newer area, good fundamentals |
| Yates Rd | 470 | 6,627 | $370,082 | Highest lot count, sub-$400K |
| Cameron Ave | 293 | 5,941 | $393,168 | Central location, smaller lots |
But remember: average land value doesn’t tell you the improvement value, and it doesn’t tell you if the owner will sell at assessment. Run the PlexRank pro forma on the specific lot to know the real ROE.
The Bottom Line
11,606 pro formas. Mean ROE: 4.9%. Median: 15%. One in four lots loses money. Only 2,111 (18.2%) clear the 20% ROE threshold that makes development risk worthwhile. Zero lots reach 100% ROE.
Kelowna’s SSMUH zoning is a policy success and an economic reality check. The zoning is there. The demand for housing is there. But the math — 86% improvement-to-land ratio, 36% gross margin, 9.5% financing — means the vast majority of these lots will remain single-family homes for the foreseeable future.
The opportunity is real but narrow: 2,111 lots where the purchase price, lot size, and improvement ratio produce viable returns. For the other 9,495, the existing home is the highest and best use.
Want to know if your Kelowna property is in the top 18.2%? VanPlex’s PlexRank tool runs a full pro forma using your actual lot size, zoning, assessment data, and comparable sales. Run your pro forma for free.
Methodology
Data sources:
- City of Kelowna GIS portal (36,117 property parcels, scraped February 2026)
- BC Assessment 2026 roll values (land, improvement, total — net values used)
- Kelowna Zoning Bylaw 12375 (zone parameters, coverage, height, unit counts)
- City of Kelowna Transit Oriented Area designations (4 exchanges)
Qualifying zone determination: MF1, RU2, RU3, RU5 per Kelowna’s SSMUH-qualifying zone list. RU1 (11,606 lots) is not currently qualifying despite being single-family residential.
PlexRank pro formas: 11,606 individual pro formas computed using VanPlex’s pro forma engine. Each uses actual lot size from GIS, BC Assessment land and improvement values, coverage-based GFA calculation per Bylaw 12375, $365/sqft construction cost, $570/sqft sales price from comparable analysis, and 9.5% financing rate. ROE calculated as project profit / equity required.
Improvement-to-land ratio: Calculated from BC Assessment 2026 net values. Improvement net value divided by land net value. Ratios above 50% indicate significant structural value that makes demolition economically questionable.
Financing assumptions: 9.5% interest rate, 2% placement fee, 60% max LTV per Kelowna-specific lender terms. Metro Vancouver markets typically access 5-7% construction financing.
Limitations:
- Assessment values are 2026 roll; market values may differ (typically higher)
- Pro formas use comparable sales at $570/sqft; actual sale prices vary by neighbourhood
- RU1 zone (11,606 lots) excluded but may become SSMUH-eligible in future updates
- Construction costs assumed stable at $365/sqft
- Individual pro formas available for any linked property via VanPlex PlexRank