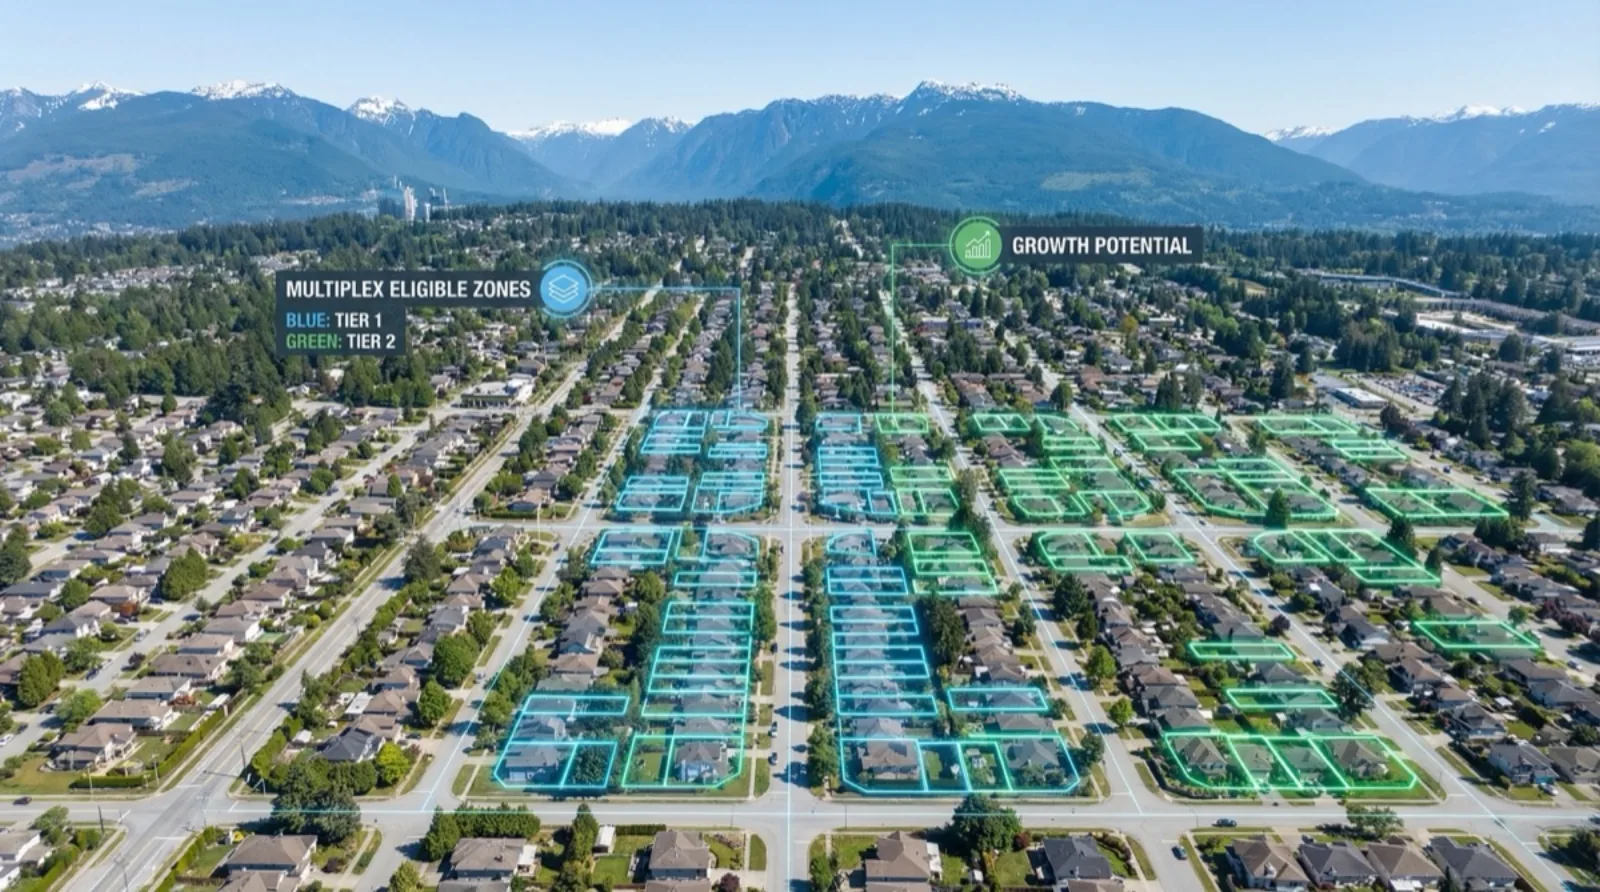

VanPlex analyzed 25,919 Richmond property parcels using municipal GIS data, BC Assessment records, and spatial lane-access mapping. Of those, 25,895 sit in RSM-qualifying zones (RSM/S, RSM/M, RSM/L, RSM/XL) and are eligible for 3-6 unit multiplex development under Bill 44. Richmond’s sliding-scale FSR formula and flat per-lot city DCC ($63,767, plus MVRD regional charges collected on behalf of Metro Vancouver) create a fundamentally different development equation than Vancouver or Coquitlam.
TL;DR (Key Takeaways)
- 25,895 Richmond lots qualify for multiplex development in RSM zones (VanPlex GIS analysis, Feb 2026)
- 99% qualify for 4+ units — only 261 lots fall below the 280 m2 threshold
- Average lot size: 6,739 sqft — larger than Vancouver’s 33-ft lots but smaller than Coquitlam
- Average land value: $1.71M across RSM zones
- City DCC: $63,767 per LOT (not per unit) + MVRD regional DCCs collected on behalf of Metro Vancouver = ~$122,831 total for a 4-unit project
- Sliding-scale FSR gives 0.60x on first 464.5 m2, then 0.30x above — smaller lots get better FSR
- 3,157 lots have lane access — 12.2% of eligible parcels
- Richmond is the only Metro Vancouver municipality with lot-based city DCC for multiplexes
- Richmond’s MVRD liquid waste rates (LISA) are lower than Fraser Sewerage Area cities like Coquitlam and Surrey
The headline number: 25,895 eligible lots
VanPlex scraped and geocoded every property parcel in the City of Richmond’s GIS portal (25,919 total records, February 2026), then cross-referenced each against zoning polygon data and BC Assessment land valuations. The result is the first comprehensive lot-level analysis of Richmond’s RSM multiplex zones.
Zone-by-zone breakdown
Richmond’s four RSM sub-zones map to lot size categories. The sub-zone determines your lot’s classification, but the development envelope (coverage, height, setbacks) is identical across all four. What actually changes your buildable area is the sliding FSR formula.
| Zone | Lots | Avg Lot Size (sqft) | Avg Land Value | Share of RSM |
|---|---|---|---|---|
| RSM/L | 14,846 | 7,883 | $1,843,219 | 57.3% |
| RSM/M | 8,650 | 5,084 | $1,566,567 | 33.4% |
| RSM/S | 2,038 | 3,846 | $1,332,362 | 7.9% |
| RSM/XL | 385 | 15,324 | $2,394,010 | 1.5% |
| Total | 25,919 | 6,739 | $1,714,958 | 100% |
Zone Distribution Visual
RSM/L dominates with 57% of eligible lots. All of these properties benefit from SSMUH rules that allow 3-6 units by right without a rezoning application. These are Richmond’s classic single-family neighborhoods — Steveston, Broadmoor, Seafair, Garden City — where the average lot runs 7,883 sqft and current land assessments average $1.84M.
RSM/M accounts for 33% with tighter lots averaging 5,084 sqft. These are concentrated along the arterial corridors: Williams Road, Francis Road, No. 1 through No. 5 Roads. RSM/S adds 7.9% with the most compact lots at 3,846 sqft average. RSM/XL is just 385 lots, but they’re substantial parcels averaging 15,324 sqft and $2.39M in assessed land value.
How Richmond compares to Coquitlam and Vancouver
| Metric | Richmond RSM | Coquitlam SSMUH | Vancouver R1-1 |
|---|---|---|---|
| Total eligible lots | 25,895 | 22,131 | 56,088 |
| Avg lot size | 6,739 sqft | 7,821 sqft | ~4,800 sqft |
| Avg land value | $1.71M | $1.43M | $2.8M+ |
| Max units (standard) | 4 | 4 | 6 |
| Max units (FTNA/transit) | 6 | N/A | 6 |
| FSR method | Sliding scale | Fixed per zone | Fixed per zone |
| City DCC | $63,767/lot | $88,207/unit | ~$82K/unit + density bonus |
| City DCC (4 units) | $63,767 | $352,828 | $328K+ |
| + MVRD regional DCCs (4 units) | ~$59,064 (LISA) | ~$79,416 (FSA) | ~$77,728 (VSA) |
| Total govt charges (4 units) | ~$122,831 | ~$432,244 | ~$406K+ |
| Density bonus fees | None | None | $200-400K above 0.7 FSR |
The $289,061 Advantage — and it’s actually bigger than the city DCC alone. Richmond’s city DCC is $63,767 per lot (Bylaw 10558). Coquitlam charges $88,207 per unit — $352,828 for a 4-plex. That city-level gap is $289,061.
But there’s a second layer: Metro Vancouver Regional District (MVRD) charges for water and liquid waste treatment, collected by municipalities on MVRD’s behalf. Richmond falls in the Lulu Island Sewerage Area (LISA), where liquid waste DCCs are $4,927/unit (townhouse rate, Jan 2025). Coquitlam is in the Fraser Sewerage Area (FSA), where liquid waste DCCs are $10,015/unit. So Richmond’s MVRD rates are lower too.
Total government charges for a 4-unit project: Richmond ~$122,831 (LISA) vs Coquitlam ~$432,244 (FSA). That’s a $309,413 total gap — and the advantage holds at every layer. Richmond’s MVRD liquid waste rates (LISA, $4,927/unit) are less than half of Coquitlam’s (FSA, $10,015/unit).
Richmond’s sliding FSR: the formula that matters
Richmond doesn’t use a flat FSR ratio like Coquitlam or Vancouver. Instead, Bylaw 8500 section 8.19 created a two-tier sliding scale that gives diminishing density returns to larger lots.
The breakpoint at 464.5 m2 (about 5,000 sqft) is where the rate drops in half. Below that threshold, you get 60 cents of floor area for every square metre of lot. Above it, you get 30 cents. The practical effect: smaller lots get proportionally better density.
Effective FSR by zone
| Zone | Avg Lot (sqft) | Avg GFA (sqft) | Effective FSR | Avg Unit Size (4 units) |
|---|---|---|---|---|
| RSM/S | 3,845 | 2,845 | 0.740 | 711 sqft |
| RSM/M | 5,089 | 3,565 | 0.701 | 891 sqft |
| RSM/L | 7,892 | 4,406 | 0.558 | 1,102 sqft |
| RSM/XL | 15,456 | 6,675 | 0.432 | 1,669 sqft |
Effective FSR by Zone (Sliding Scale)
Compare that to Coquitlam’s R-1 zone: flat 0.75 FSR regardless of lot size. A 20,000 sqft Coquitlam R-1 lot gets 15,000 sqft of buildable area. A 20,000 sqft Richmond lot gets roughly 6,900 sqft. The sliding scale heavily penalizes large lots.
The sweet spot in Richmond? RSM/M lots in the 5,000-7,000 sqft range. You still get a respectable 0.65-0.70 effective FSR, the lot is large enough for functional 4-unit site plans, and the land values ($1.5-1.7M) haven’t hit the premium tier.
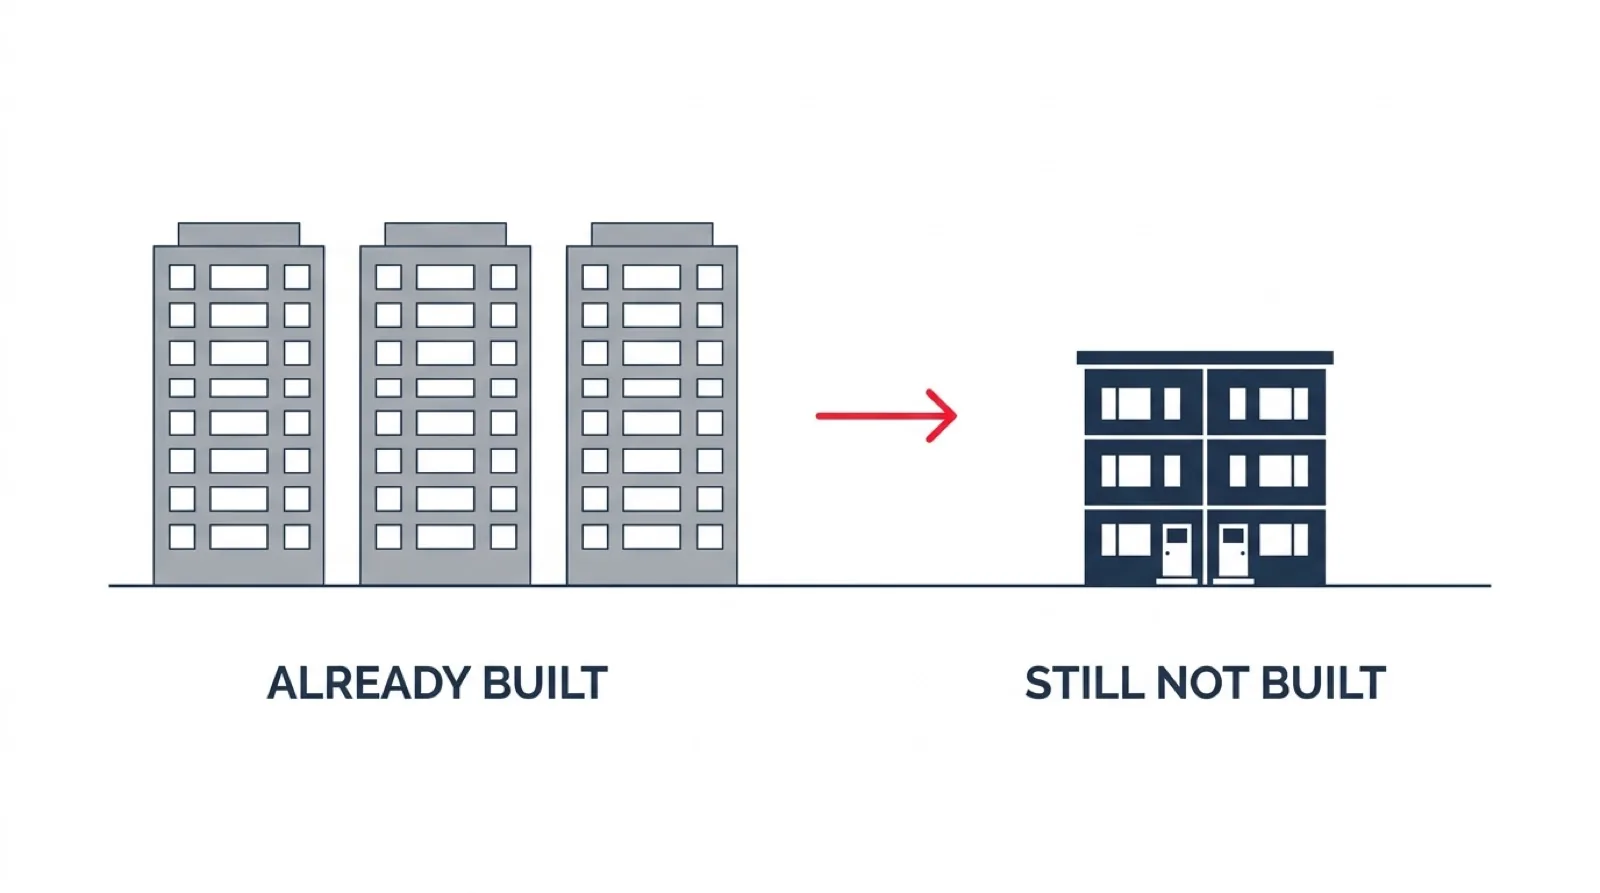
99% qualify for 4+ units
Under Bill 44’s SSMUH rules, the unit threshold is 280 square metres (3,014 sqft). Below that, you get 3 units. At or above, you get 4.
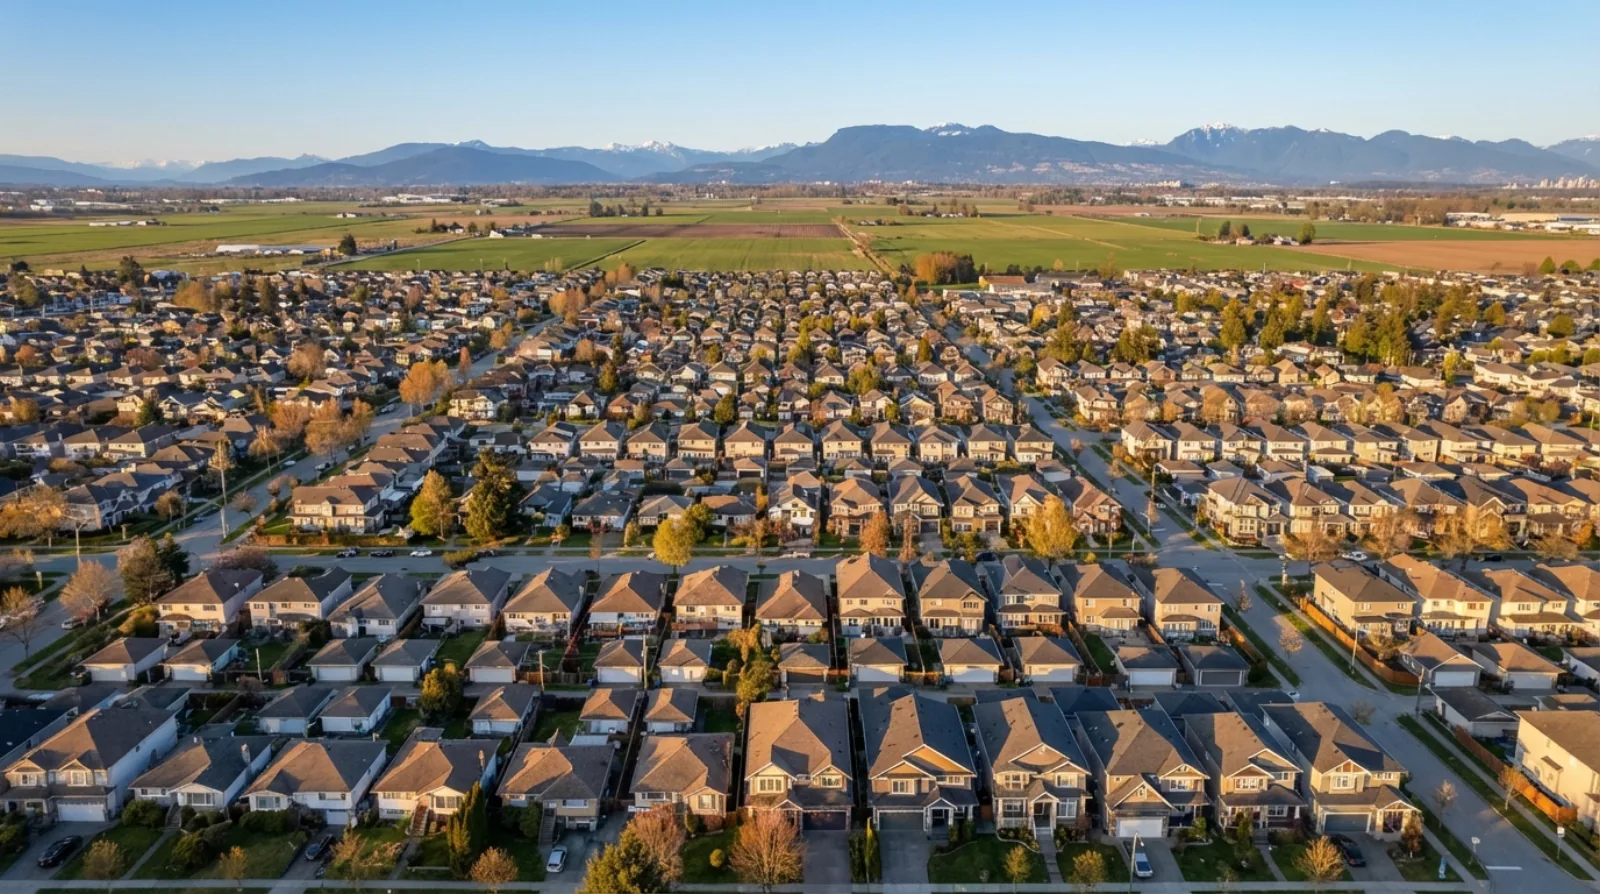
Lot size distribution: where the land is
Lot Size Distribution (25,786 RSM Lots with Area)
The Distribution Story: Coquitlam and Richmond have similar lot profiles — Coquitlam’s most common range is also 6,000-8,000 sqft (BCA avg 7,821 sqft). Richmond’s eligible lots cluster in the 3,000-10,000 sqft range — that’s 23,717 lots, 92% of the total. This is a market of moderate-sized lots with moderate land values. The sliding FSR rewards exactly this lot profile with effective FSRs between 0.55 and 0.74.
Where the concentration is: top development corridors
The top streets by lot count in RSM zones reveal where development will concentrate:
| Street | RSM Lots | Avg Lot Size (sqft) | Avg Land Value |
|---|---|---|---|
| Williams Rd | 564 | 6,141 | $1,471,557 |
| Francis Rd | 369 | 7,488 | $1,705,120 |
| Blundell Rd | 232 | 7,676 | $1,759,832 |
| No. 1 Rd | 229 | 5,594 | $1,487,751 |
| No. 4 Rd | 206 | 8,045 | $1,630,403 |
| No. 2 Rd | 196 | 7,177 | $1,734,730 |
| Granville Ave | 185 | 8,661 | $1,880,103 |
| Steveston Hwy | 181 | 6,831 | $1,541,000 |
| Railway Ave | 162 | 6,750 | $1,719,222 |
Williams Road alone has 564 RSM lots. Add Francis, Blundell, and the numbered Roads, and these corridors account for thousands of eligible properties within walking distance of transit, schools, and commercial nodes. Richmond’s grid-pattern street network makes these corridors particularly efficient for phased multiplex rollout.
Land values: the middle ground
Average Land Value by Zone (BC Assessment, 2025-2026)
Richmond sits between Coquitlam ($1.43M average) and Vancouver ($2.8M+). The $1.71M average across RSM zones reflects Richmond’s position as a mature suburban market with strong Asian-community ties, good schools, and direct Canada Line access to downtown Vancouver.
The land value distribution tells a clearer story:
| Value Range | Lots | Share |
|---|---|---|
| Under $1M | 81 | 0.3% |
| $1M - $1.5M | 6,786 | 26.3% |
| $1.5M - $2M | 14,640 | 56.8% |
| $2M - $3M | 4,073 | 15.8% |
| Over $3M | 237 | 0.9% |
Over 83% of RSM lots are assessed between $1M and $2M. That’s a remarkably tight distribution — good news for underwriting consistency, since you’re not dealing with the wild valuation swings you see in Vancouver’s west side vs east side.
Lane access: 3,157 lots with rear access
With Lane Access
- Rear parking access
- Better unit orientation
- Service/utility routing
- Higher site efficiency
- Reduced driveway cuts
Without Lane Access
- Side-access driveways
- Front-oriented parking
- Different site planning
- Still fully eligible
- Slightly higher site costs
Lane access is unevenly distributed across zones. RSM/S leads at 45.6% (930 of 2,038 lots have lanes), while RSM/M has only 5.6%. This makes sense geographically — RSM/S lots tend to cluster in older Richmond neighborhoods like Brighouse and the city centre where rear lanes were part of the original subdivision pattern.
| Zone | With Lane | Without Lane | Lane Rate |
|---|---|---|---|
| RSM/S | 930 | 1,108 | 45.6% |
| RSM/L | 1,732 | 13,114 | 11.7% |
| RSM/M | 486 | 8,164 | 5.6% |
| RSM/XL | 9 | 376 | 2.3% |
The economics: what a Richmond multiplex costs
How much does it cost to build a multiplex in Richmond?
Pro Forma: Typical RSM/L Lot (8,000 sqft, $1.84M land, no lane)
Costs
| Category | Amount |
|---|---|
| Land (assessed) | $1,840,000 |
| Construction (4,438 sf x $425) | $1,886,150 |
| Govt charges (city + MVRD) | $122,831 |
| Interest and placement | ~$109,000 |
| Realtor commissions | ~$106,500 |
| Total Cost | $4,064,481 |
Revenue
| Category | Amount |
|---|---|
| Lot (m2) | 743 m2 |
| Base GFA | 362 m2 (sliding FSR) |
| + Flex | 50 m2 |
| Total GFA | 4,438 sqft |
| Units | 4 |
| Sale price ($800/sqft) | $3,550,400 |
| Project Profit | -$514,081 |
At $800/sqft and average RSM/L land values, the standard model shows negative returns. Profit depends on land acquisition below assessment and/or premium comps.
The numbers above use average values. Averages don’t build buildings. What matters is finding the lots where the spread between land cost and development value is wide enough.
What makes a Richmond lot profitable?
Pro Forma: Sweet-Spot RSM/M Lot (6,000 sqft, $1.3M land, lane access)
Costs
| Category | Amount |
|---|---|
| Land (below market) | $1,300,000 |
| Construction (3,838 sf x $425) | $1,631,150 |
| Govt charges (city + MVRD) | $122,831 |
| Interest and placement | ~$94,500 |
| Realtor commissions | ~$92,100 |
| Total Cost | $3,240,581 |
Revenue
| Category | Amount |
|---|---|
| Lot (m2) | 557 m2 |
| Sliding FSR GFA | 3,838 sqft |
| Units | 4 |
| Sale price ($850/sqft) | $3,262,300 |
| Project Profit | $21,719 |
| ROE | ~2% |
Below-market land acquisition + $122,831 total govt charges (city + MVRD) + premium location comps determine viability
The deals that pencil out share specific traits:
Government charges: the full picture
Richmond’s city DCC is $63,767 per lot (Bylaw 10558) — the only lot-based DCC in Metro Vancouver. But that’s not the whole story. Municipalities also collect regional DCCs on behalf of Metro Vancouver Regional District (MVRD) for water treatment and liquid waste services. These MVRD charges are per unit.
City DCC + MVRD regional charges
| Charge Layer | Richmond (4 units) | Notes |
|---|---|---|
| City DCC (Bylaw 10558) | $63,767 | Per lot — same whether 3, 4, or 6 units |
| MVRD Water DCC | ~$39,356 (4 x $9,839) | Uniform across all MVRD member municipalities |
| MVRD Liquid Waste DCC (LISA) | ~$19,708 (4 x $4,927) | Townhouse rate, Jan 2025 |
| Total Government Charges | ~$122,831 | Collected by Richmond on behalf of MVRD |
| Per-Unit Equivalent | ~$30,708 |
Why This Still Matters: Even with MVRD regional charges included, Richmond’s total government charges (~$122,831) are far below Coquitlam’s. The per-lot city DCC structure (Bylaw 10558) means adding a 5th or 6th unit in an FTNA zone costs zero additional city fees — you only add the MVRD per-unit regional charges. In Coquitlam, each additional unit adds $88,207 in city DCC plus MVRD charges.
Sewerage Area Note: Most RSM lots in western and central Richmond drain to the Lulu Island treatment plant, falling in the Lulu Island Sewerage Area (LISA) — operated by MVRD. Liquid waste DCCs here are $4,927/unit (townhouse, Jan 2025). A small number of lots in eastern Richmond drain to Annacis Island and fall in the Fraser Sewerage Area (FSA), where liquid waste DCCs are significantly higher at $10,015/unit. The numbers above use LISA rates, which apply to the vast majority of RSM-eligible properties.
Development parameters: identical across all RSM zones
Unlike Coquitlam where R-1 through R-4 each have different FSR ratios, coverage limits, and setbacks, Richmond’s RSM zones share one envelope:
| Parameter | All RSM Zones |
|---|---|
| Site Coverage | 45% |
| Height | 10.0m (2.5 storeys) |
| Front Setback | 6.0m |
| Rear Setback | 6.0m |
| Side Setback | 1.2 - 2.0m |
| FSR | Sliding scale (see formula above) |
| Max Units | 3-6 (lot size + FTNA dependent) |
The simplicity is a feature. One set of rules for every RSM lot in the city. The only variables that change your proforma are lot size, land value, and whether you’re in an FTNA transit area.
Is my Richmond property eligible for multiplex development?
If your property meets these criteria, it qualifies:
Visit VanPlex.ca to check your specific Richmond property. Enter your address to see your lot size, RSM zone, buildable area from the sliding FSR formula, estimated project costs, and comparable sales — all calculated from real GIS data and assessment records. The advanced proforma calculator lets you model the full development economics before committing to anything.
Methodology and data sources
Data Pipeline:
- Property parcels: Scraped from Richmond’s RIM MapServer (ArcGIS REST API, 25,919 records with OBJECTID-based pagination)
- Zoning classification: RSM sub-zone parsed from compound zoning codes (e.g., “RSM/L, RSM/M” resolved to primary zone)
- Lane access: OpenStreetMap lane polylines with 30-metre buffer analysis against parcel centroids
- Assessment values: BC Assessment land, improvement, and total valuations (25,817 successful lookups)
- Lot areas: SHAPE_Area field from Richmond GIS (square metres, converted to sqft)
- Home linking: Address matching against 38,213 Richmond homes in VanPlex database (99.7% match rate)
Last updated: February 2026
Coverage: All residential parcels within Richmond’s RSM zoning overlay
Note on FTNA: Richmond’s Frequent Transit Network Area boundaries have not yet been published by the City. The isTransitOriented flag is not currently populated. Once FTNA boundaries are available, properties within the overlay and above 281 m2 will qualify for up to 6 units.
David Babakaiff, CEO and Co-Founder of VanPlex PlexRank(TM) | Profit with Multiplex