
VanPlex analyzed 27,874 Coquitlam property parcels using municipal GIS data, BC Assessment records, and spatial lane-access mapping. Of those, 22,131 sit in SSMUH-qualifying zones (R-1 through R-4) and qualify for up to 4 units under Bill 44. Here’s exactly what the data reveals about Coquitlam’s multiplex landscape — and why the economics differ fundamentally from Vancouver.
TL;DR (Key Takeaways)
- 22,131 Coquitlam lots qualify for multiplex development in R-1 through R-4 zones (VanPlex GIS analysis, Feb 2026)
- 99.96% qualify for 4 units — only 8 lots fall below the 280 m2 (3,014 sqft) threshold
- Average lot size: 7,821 sqft (BC Assessment legal) — the most common range is 6,000-8,000 sqft
- Average land value: $1.43M across SSMUH zones vs $2.8M+ in Vancouver
- 5,112 lots have lane access — enabling better site configurations for 4-plex builds
- Government charges: $88,207 per unit (DCC + ACC + Metro levies) — no density bonus fees
- FSR-based system means lot size directly determines buildable area — no frontage gatekeeping
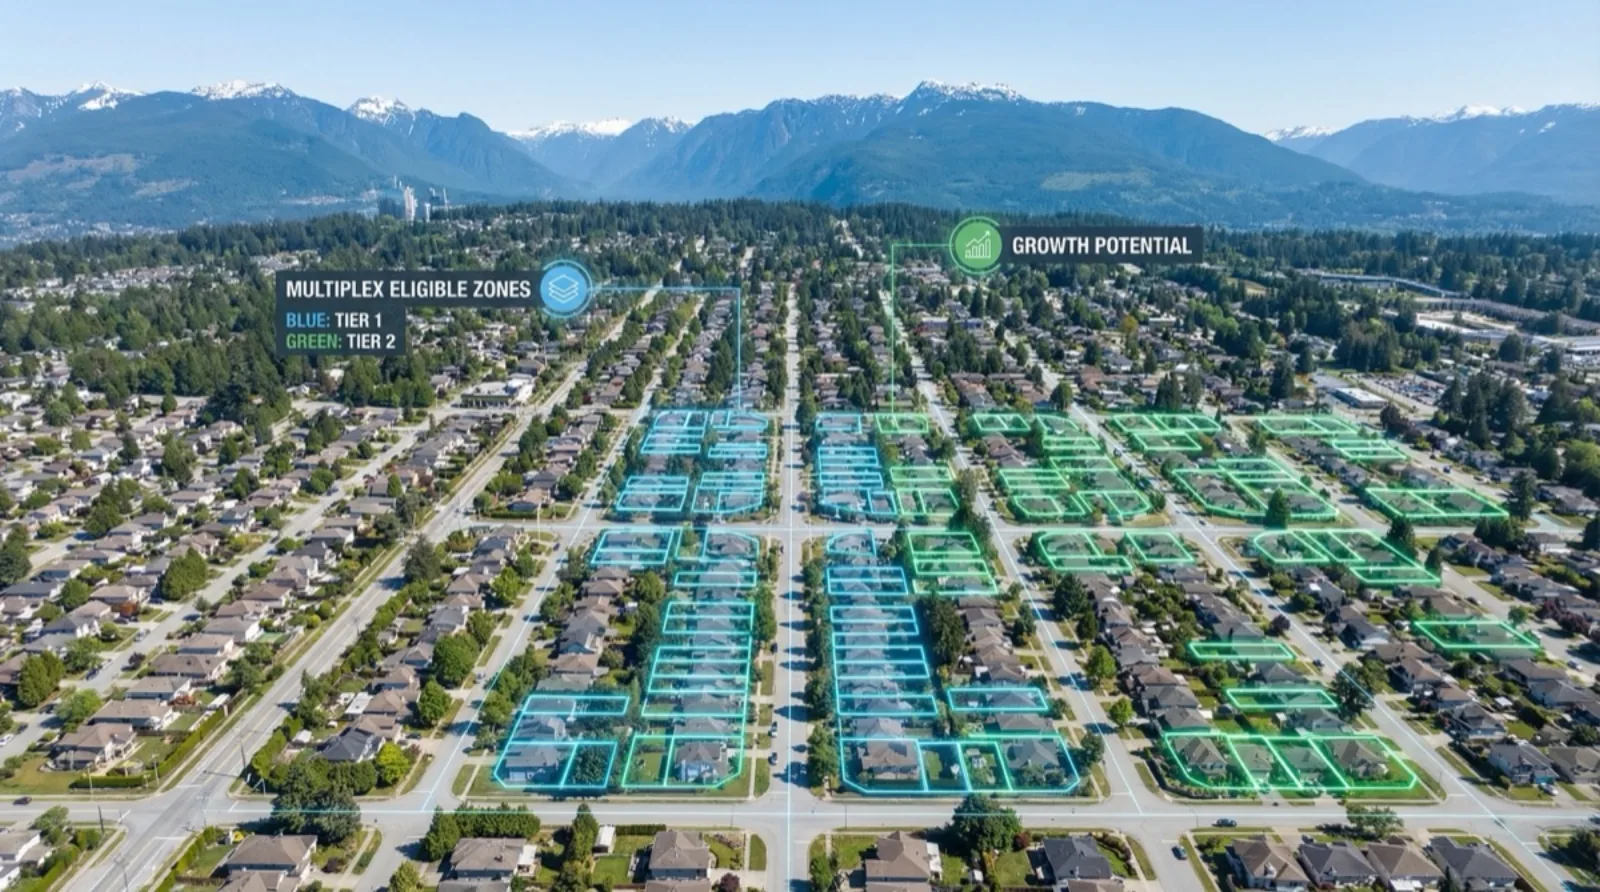
The Headline Number: 22,131 Eligible Lots
VanPlex scraped and geocoded every property parcel in the City of Coquitlam’s GIS portal (27,874 total records, February 2026), then cross-referenced each against zoning polygon data and BC Assessment land valuations. The result is the most comprehensive lot-level eligibility analysis ever published for Coquitlam’s SSMUH zones.
Zone-by-Zone Breakdown
Coquitlam’s four SSMUH-qualifying residential zones show distinct characteristics:
| Zone | Lots | Avg Lot Size (sqft) | Avg Land Value | Share of SSMUH |
|---|---|---|---|---|
| R-1 | 13,552 | 20,248 | $1,504,221 | 61.2% |
| R-2 | 5,530 | 13,085 | $1,303,157 | 25.0% |
| R-3 | 3,030 | 19,714 | $1,352,655 | 13.7% |
| R-4 | 19 | 37,284 | $1,224,211 | 0.1% |
| Total | 22,131 | 7,821 | $1,430,061 | 100% |
Zone Distribution Visual
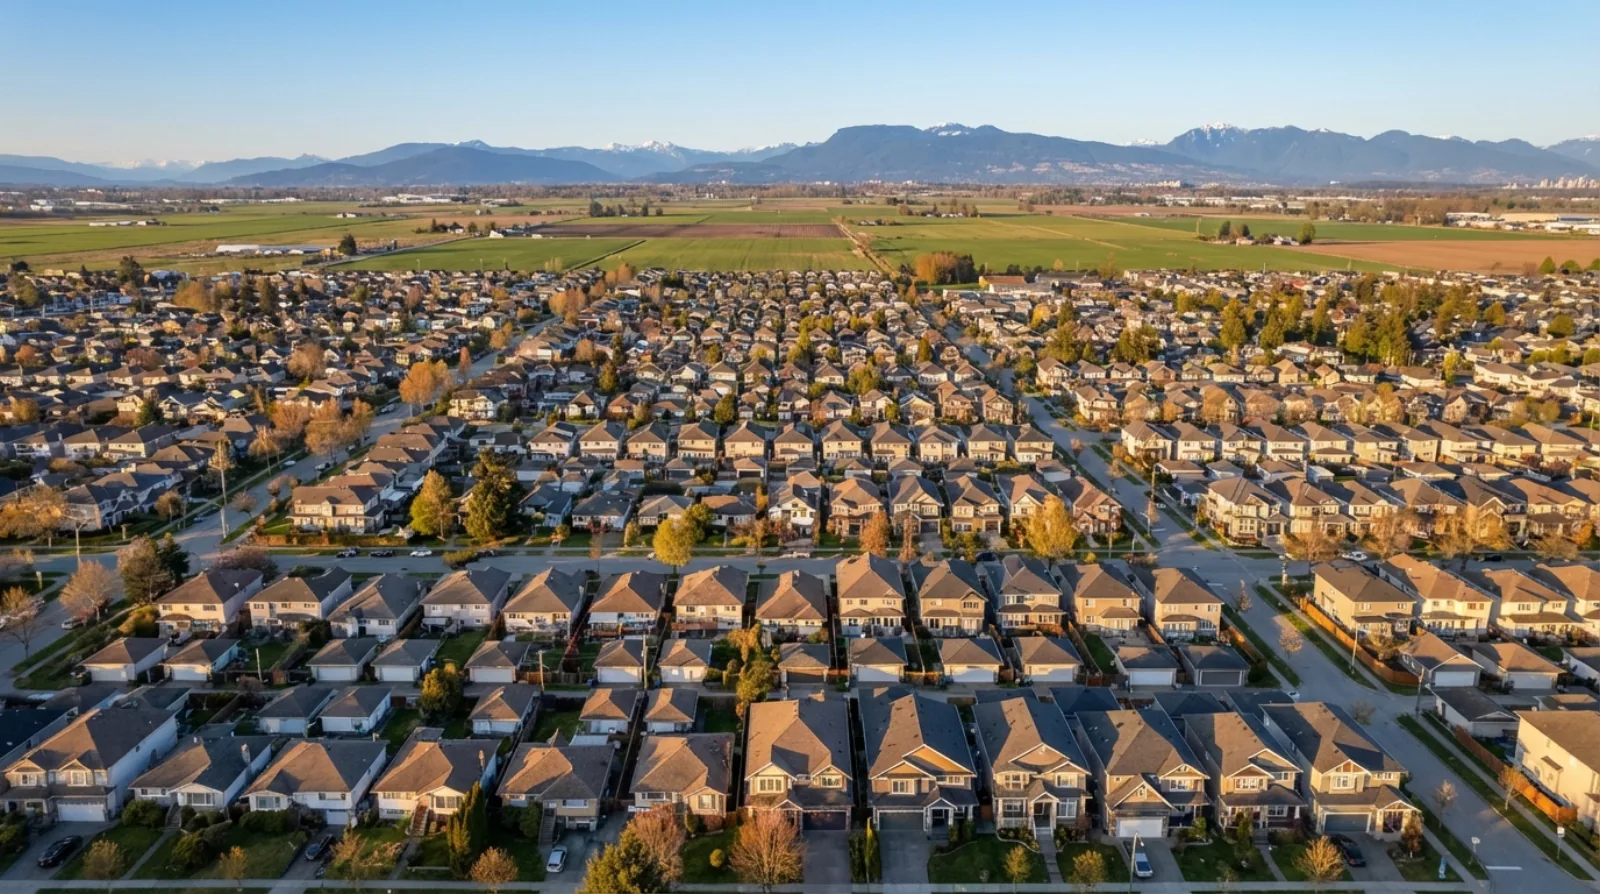
R-1 dominates with 61% of eligible lots. These are Coquitlam’s classic single-family neighborhoods. The SSMUH rules that apply across BC set the minimum unit counts — Coquitlam’s zoning then adds its own FSR limits on top. — Burke Mountain, Ranch Park, Central Coquitlam — where the average lot runs 20,248 sqft and current land assessments average $1.5M.
R-2 accounts for 25% with tighter lots averaging 13,085 sqft and slightly lower assessments at $1.3M. R-3 adds another 13.7% with large lots averaging 19,714 sqft. R-4 is negligible at just 19 lots, though these are substantial parcels averaging 37,284 sqft.
How Coquitlam Compares to Vancouver
| Metric | Coquitlam SSMUH | Vancouver R1-1 |
|---|---|---|
| Eligible lots | 22,131 | 56,088 |
| Avg lot size | 7,821 sqft | ~4,800 sqft |
| Avg land value | $1.43M | $2.8M+ |
| Max units | 4 | 6 |
| Frontage req. | None (FSR-based) | 44-50 ft (5-6 units) |
| Govt charges/unit | $88,207 | $82K+ (+ density bonus) |
| Density bonus | None | $200-400K (>0.7 FSR) |
Key Insight: Coquitlam uses an FSR-based system where your lot size directly determines buildable gross floor area. No frontage gatekeeping. No 33-foot lot penalty. A 10,000 sqft R-1 lot building 4 units at 0.75 FSR gets 7,500 sqft of buildable area — period. In Vancouver, thousands of technically eligible lots are blocked by frontage requirements (44 ft minimum for 5 units, 50 ft for 6). That constraint doesn’t exist in Coquitlam.
Almost Every Lot Qualifies for 4 Units
Under BC’s SSMUH rules, the unit threshold is 280 square metres (3,014 sqft). Below that, you get 3 units. At or above, you get 4.
This is not Vancouver, where lot configuration and frontage create a complex eligibility matrix. In Coquitlam, if you’re in R-1 through R-4 zoning, you almost certainly qualify for 4 units.
Lot Size Distribution: Where the Land Really Is
Lot Size Distribution (27,874 Coquitlam Properties, BC Assessment Legal)
The Big Number: The most common lot size in Coquitlam is 6,000-8,000 sqft (9,094 properties, 32.6%), with over 22% of all properties exceeding 10,000 sqft. For context, a 15,000 sqft R-1 lot at 0.75 FSR yields 11,250 sqft of buildable area: four generous 2,800 sqft townhome-style units. These are house-sized units, not compact apartments.
Where the Concentration Is: Top Development Corridors
The top streets by lot count in SSMUH zones reveal where development activity will concentrate:
| Street | SSMUH Lots | Avg Lot Size (sqft) | Primary Zone |
|---|---|---|---|
| Como Lake Ave | 180+ | 14,500 | R-1, R-2 |
| Austin Ave | 150+ | 16,200 | R-1 |
| Rochester Ave | 130+ | 18,700 | R-1 |
| Regan Ave | 120+ | 15,900 | R-1, R-3 |
| Foster Ave | 110+ | 17,300 | R-1 |
| Dansey Ave | 100+ | 19,100 | R-1 |
Austin Ave and Como Lake Ave offer strong transit proximity (bus connections to Evergreen Line) combined with established neighborhood amenity infrastructure — schools, parks, commercial retail within walking distance.
Land Values: The Affordability Advantage
Average Land Value by Zone (BC Assessment, 2025-2026)
The $1.43M average land value across all SSMUH zones is 49% below Vancouver’s $2.8M+ average for R1-1 lots. This translates directly into project economics: lower land cost means a lower total capital requirement and a more achievable equity threshold for homeowner-builders.
Within Coquitlam, R-1 commands the premium ($1.5M average) — these tend to be established neighborhoods with mature infrastructure. R-4 zones are cheapest ($1.22M) but represent just 19 lots. For investors, R-2 zones at $1.3M average offer the strongest value-to-buildable-area ratio given their smaller lots still produce competitive FSR-derived floor areas.
Lane Access: 5,112 Lots with Rear Access
With Lane Access
- Rear parking access
- Better unit orientation
- Service/utility routing
- Higher site efficiency
- Reduced driveway cuts
Without Lane Access
- Side-access driveways
- Front-oriented parking
- Different site planning
- Still fully eligible
- Slightly higher site costs
Lane access enables rear parking configurations that free the street frontage for unit entrances, improving both street appeal and functional layout. VanPlex’s spatial analysis identified lane access using a 30-metre buffer from Coquitlam’s 536 mapped lane segments (City of Coquitlam Transportation GIS layer, February 2026).
The Economics: What a Coquitlam 4-Plex Actually Costs
How Much Does It Cost to Build a Multiplex in Coquitlam?
Pro Forma: Typical R-1 Lot (15,000 sqft, $1.5M land, no lane)
Costs
| Category | Amount |
|---|---|
| Land (assessed) | $1,500,000 |
| Construction (4,500 sf x $425) | $1,912,500 |
| Govt charges (4 x $88,207) | $352,828 |
| Interest and placement | ~$165,000 |
| Realtor commissions | ~$190,000 |
| Total Cost | $4,120,328 |
Revenue
| Category | Amount |
|---|---|
| Buildable area (0.75 FSR) | 11,250 sqft |
| Market-capped GFA | 4,500 sqft |
| Sale price ($850/sqft) | $3,825,000 |
| Project Profit | -$295,328 |
| ROE | Negative |
At $850/sqft and $1.5M land, the standard model shows negative returns. The economics require specific conditions to work.
What Makes a Coquitlam Lot Work?
The deals that pencil out share these specific traits:
VanPlex analysis shows approximately 3,200 lots in Coquitlam that meet at least three of these criteria — representing the actionable opportunity set.
Government Charges: $88,207 Per Unit
Coquitlam’s per-unit government charges are fixed and predictable — unlike Vancouver’s layered density bonus contribution structure:
| Charge | Per Unit | Per 4-Unit Project |
|---|---|---|
| Development Cost Charges (DCC) | $38,500 | $154,000 |
| Amenity Cost Charges (ACC) | $22,707 | $90,828 |
| Metro Vancouver Water | $8,500 | $34,000 |
| Metro Vancouver Sewer | $7,500 | $30,000 |
| TransLink DCL | $6,000 | $24,000 |
| School Site Acquisition | $5,000 | $20,000 |
| Total | $88,207 | $352,828 |
Government Charges Breakdown (Per Unit)
No Density Bonus Fees: Unlike Vancouver, Coquitlam has no density bonus contribution system. In Vancouver, building above 0.7 FSR triggers additional per-sqft fees that can add $200-400K to a project. Coquitlam’s flat per-unit model is simpler and more predictable for underwriting.
Development Parameters by Zone
What Is the FSR for Each Coquitlam Zone?
Each zone has specific development parameters (City of Coquitlam Zoning Bylaw 3000, Part 10 — Bylaw 5449, adopted June 23, 2025, updated September 8, 2025):
| Parameter | R-1 | R-2 | R-3 | R-4 |
|---|---|---|---|---|
| FSR (1-2 units) | 0.65 | 0.75 | 0.50 | n/a |
| FSR (3-4 units) | 0.75 | 0.75 | 0.50 | 0.85 |
| Site Coverage | 50% | 50% | 45% | 50% |
| Max Units | 4 principal | 4 principal | 2 principal + 2 accessory | Min 3 required |
| Min Lot Area | 650 m2 | 465 m2 | 650 m2 | 930 m2 |
| Min Lot Width | 18.5m | 12.5m | 18.5m | Not specified |
| Avg Lot in Zone | 20,248 sqft | 13,085 sqft | 19,714 sqft | 37,284 sqft |
| Avg Buildable GFA | 15,186 sqft | 9,814 sqft | 9,857 sqft | 31,691 sqft |
| Avg Unit Size | 3,797 sqft | 2,454 sqft | 2,464 sqft | 7,923 sqft |
Buildable GFA by Zone (Avg Lot x FSR for 3-4 units)
R-4 offers the highest FSR (0.85) and 50% coverage, making it the most development-generous zone — though only 19 lots are zoned R-4. Among the common zones, R-1 and R-2 share the best FSR for 3-4 unit builds (0.75) with 50% coverage. A 20,000 sqft R-1 lot yields 15,000 sqft of buildable GFA — four units averaging 3,750 sqft each. These are house-sized units, not compact apartments.
R-2 zones match R-1’s FSR (0.75) and benefit from established neighborhood infrastructure and often better transit access. A 13,000 sqft R-2 lot produces 9,750 sqft of buildable area — four units at 2,438 sqft each, competitive with new-build townhome product in Coquitlam.
R-3 has a lower FSR (0.50) and a critical structural difference: it allows a maximum of 2 principal dwelling units plus 2 accessory dwelling units only. Accessory units cannot be independently financed or sold as principal units — a key distinction for investors. R-4 requires a minimum of 3 dwelling units and cannot be used for 1-2 unit builds.
The Strategic Picture: Coquitlam vs Vancouver Investment Thesis
Vancouver
- Land cost: $2.8M+ average
- Complex zoning (frontage, density bonus, heritage)
- 518+ applications filed
- Established competition
- Higher per-unit sale prices ($1,000-1,400/sqft)
- Density bonus fees above 0.7 FSR
- 33-ft lot penalty (max 4 units)
Coquitlam
- Land cost: $1.43M average (-49%)
- Simple FSR-based zoning
- Early-stage market (minimal competition)
- Avg lot 7,821 sqft (most common: 6,000-8,000)
- Lower per-unit prices ($800-900/sqft)
- No density bonus fees
- No frontage gatekeeping
The trade-off: Lower per-unit sale prices, but dramatically lower entry cost and simpler execution. For capital-constrained developers, Coquitlam offers a pathway Vancouver’s $3M+ entry point makes inaccessible.
Is My Coquitlam Property Eligible for Multiplex Development?
If your property meets these criteria, it qualifies:
Visit VanPlex.ca to check your specific Coquitlam property, or use the advanced proforma calculator to model the development economics on your lot. Enter your address to see your lot size, zoning code, FSR, buildable area, estimated project costs, and comparable sales — all calculated from real GIS data and assessment records, not estimates.
Methodology and Data Sources
Data Pipeline:
- Property parcels: Scraped from Coquitlam’s ArcGIS portal (geodata.coquitlam.ca, Cadastral layer, 71,849 raw records including condo units, consolidated to 27,874 unique parcels)
- Zoning classification: Spatial join of parcel centroids against Coquitlam Planning zoning polygons (230 zones mapped)
- Lane access: Spatial buffer analysis (30m) of parcel centroids against Coquitlam Transportation lane polylines (536 lane segments)
- Assessment values: BC Assessment land and improvement valuations scraped for each PID (55,144 successful lookups out of 57,447 parcels with PIDs)
- Geocoding: BC Geocoder API for address standardization and coordinate verification
Last updated: February 2026
Coverage: All residential parcels within Coquitlam municipal boundary
David Babakaiff, CEO and Co-Founder of VanPlex PlexRank(TM) | Profit with Multiplex