
Canada’s national home-price index sat 29.3% below its early-2022 peak in the first quarter of 2026, after adjusting for inflation. That figure is the change recorded in the Bank for International Settlements’ Canadian residential property-price series. It means the national index fell that far relative to consumer prices. Any one home’s dollar value moved on its own path.
For multiplex investors, that chart raises a more useful question than whether prices eventually recover:
When the project is finished, the taxes are paid and your capital is returned, how much more will your money actually buy?
The Canadian chart: home prices with inflation removed
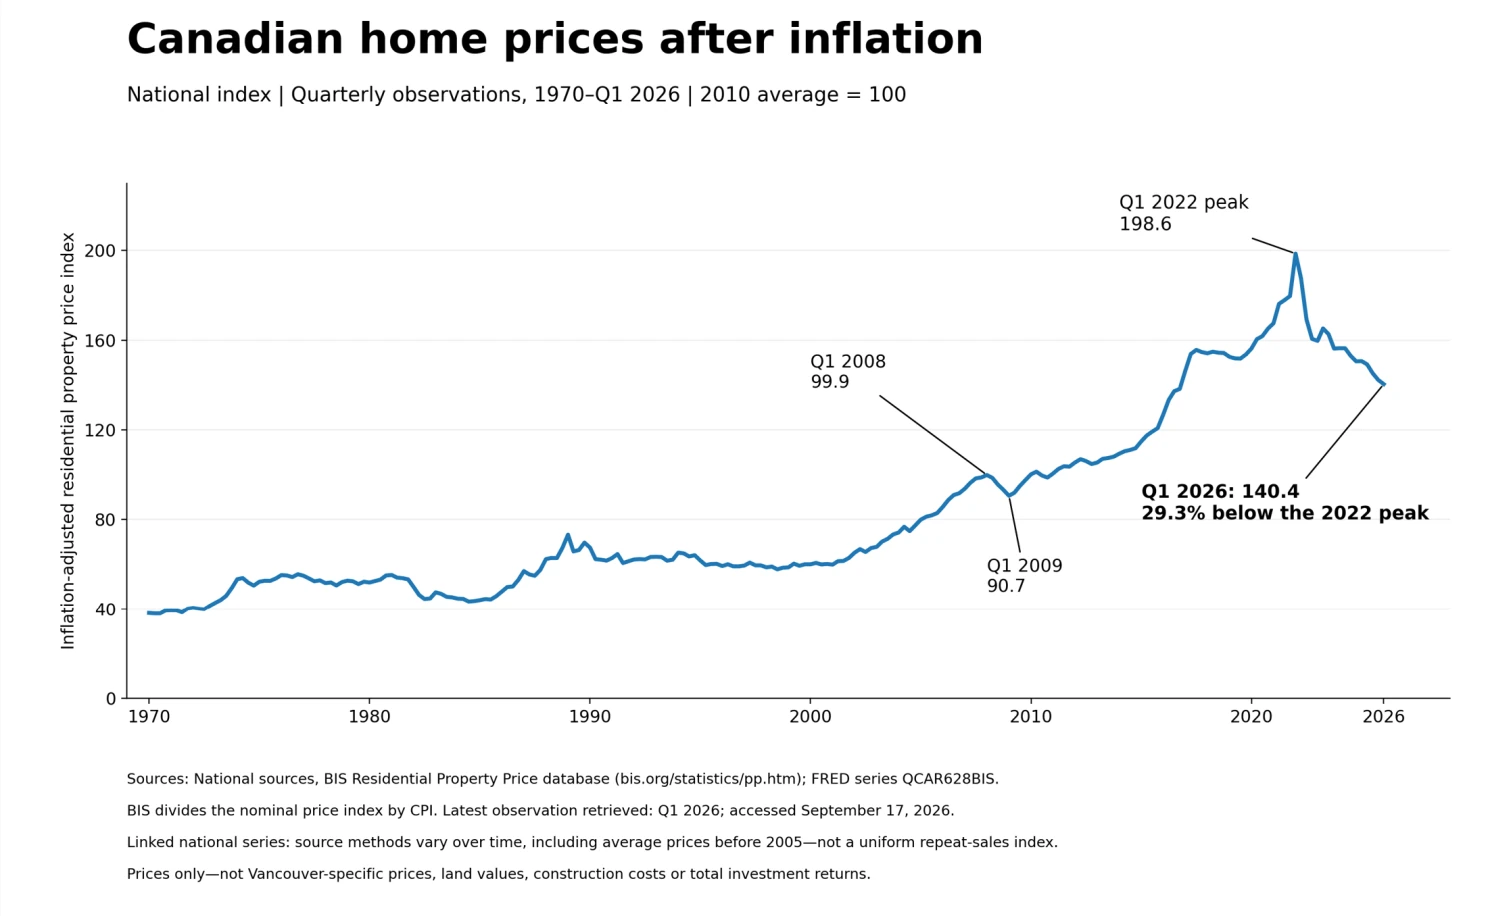
Think of inflation adjustment as putting prices from different years into dollars with the same purchasing power.
When the line rises, home prices are increasing faster than consumer prices. When it falls, housing is losing ground against the general cost of living.
Two things to know before you read too much into it. This long Canadian series links together different historical price measures, so it tracks a national blend rather than the same house changing hands since 1970. And it covers prices only. Your rental income, development profit, borrowing costs, taxes and return on equity each need their own calculation.
So the 29.3% decline is no number to subtract from a projected multiplex return. It is a reason to stop treating price appreciation as a dependable substitute for sound investment economics.
What Keen and Shiller bring to the question
I have been combining Steve Keen’s work on private debt and credit with Robert Shiller’s work on prices and investor psychology in a framework I call Keen Shiller Forecasts. This is my own synthesis. Neither of them has endorsed it or produced it with me.
Shiller examines how persuasive stories influence investment decisions. His work encourages us to question the assumptions behind a familiar property narrative: hold long enough, and you will make money.
Keen emphasizes the role of private debt and credit in economic activity. His work draws attention to the financing obligations that remain when market conditions weaken.
For multiplex investing, my application is simple. An eventual recovery is never enough on its own. The investment needs to produce an adequate return within the time your capital and financing can support.
And “adequate return” should mean more than a larger dollar balance.
Why a 20% return can leave you 7.5% richer
Let’s use a hypothetical Canadian multiplex investment.
You contribute $1 million of equity. Two years later, after the project’s borrowing has been repaid and all development costs, financing costs, fees and agreed profit-sharing have been accounted for, you receive your capital plus $200,000 of profit before your income taxes.
The proposal delivered a 20% total return on your equity over two years.
Now assume, purely for this illustration, that the effective tax on your profit is 30% and consumer inflation averages 3% a year during those two years.
| What happens to your investment | Amount |
|---|---|
| Your original invested capital | $1,000,000 |
| Capital returned plus profit, before income tax | $1,200,000 |
| Illustrative tax on the $200,000 profit | -$60,000 |
| Capital and profit remaining after tax | $1,140,000 |
| Purchasing power of that money, in dollars from the investment’s start date | $1,074,600 |
| Increase in purchasing power above your original capital | $74,600 |
Why the last adjustment? At 3% annual inflation, something costing $100 at the start costs $106.09 two years later. Your returned money has to stretch across those higher prices, so $1,140,000 divided by 1.0609 is $1,074,600 in start-date dollars.
The result: 20% before tax and inflation becomes 7.5% after tax and inflation over the same two years.
Put both figures on an annual basis and the comparison is 9.5% a year before tax and inflation versus 3.7% a year after both.
These are calculations from the stated assumptions. They are no forecast of any project.
You have still made money. Your purchasing power has increased by far less than the headline profit suggests. Quebec’s financial regulator, the Autorité des marchés financiers, makes the same point on its inflation page: the return to measure against inflation is the after-tax return.
Inflation also works on the purchasing power of your entire returned capital, all $1,140,000 of it, including the original $1,000,000 you put in.
The 30% tax assumption is my illustration and no stated Canadian tax rate for multiplex investments. The Canada Revenue Agency distinguishes different types of real-estate income and treats buying to build and sell for profit as business income. Your ownership structure and circumstances need their own tax calculation. The example assumes one initial investment, one final distribution and taxes paid at the end.
Time changes the result even when the profit stays the same
Suppose that same investment takes three years instead of two, but still returns the same $200,000 pre-tax profit.
Keep the illustrative tax and inflation assumptions unchanged. The after-tax, inflation-adjusted annual return falls from 3.7% to 1.4%.
| Same $200,000 profit on $1,000,000 equity | Two years | Three years |
|---|---|---|
| Pre-tax total return | 20% | 20% |
| Pre-tax annual return | 9.5% | 6.3% |
| After-tax money returned | $1,140,000 | $1,140,000 |
| Purchasing power in start-date dollars (3% inflation) | $1,074,600 | $1,043,300 |
| After-tax, inflation-adjusted total return | 7.5% | 4.3% |
| After-tax, inflation-adjusted annual return | 3.7% | 1.4% |
That calculation generously assumes the delay adds no extra cost and leaves the dollar profit untouched. On a real site the extra year carries interest, insurance, property tax and overhead, so the dollar profit usually shrinks as well.
This is why I would never assess a multiplex opportunity from its projected profit percentage alone. The amount earned, the tax payable and the time your money is committed belong in the same conversation.
For projects with staged capital contributions or distributions, run the calculation on the actual dates and amounts of those cash flows.
What this changes for multiplex investing in 2027 to 2029
The Canadian chart tells us nothing about where prices go next. It does tell us why I would avoid making appreciation essential to an investment’s success.
My working outlook remains selective rather than uniformly bearish. Opportunities may emerge where land can be acquired on terms that support profitable development at defensible completed-home values.
Before investing, I would ask for three answers.
- What does my capital earn without market appreciation? Show the project using supportable local selling prices or rents, with no assumed annual increase applied until completion.
- What do I retain after tax and inflation? Show the investor’s return on contributed equity as well as the developer’s project margin. Make the tax, inflation and timing assumptions visible.
- What remains when the project takes longer or sells for less? Show the effect on both the money returned and the annual return. Then explain how the available capital and financing cover that scenario.
I would compare the resulting return with alternatives on the same after-tax, inflation-adjusted basis, while accounting for differences in risk, liquidity and effort.
A positive real return is useful. On its own it may still be too little compensation for development risk.
And looking toward 2030 to 2035?
Assuming continued AI advancement, I expect better analysis and coordination to create opportunities for improved development economics. That is a scenario to test. It is no construction saving to put into today’s land offer.
The investor question is whether you keep the benefit.
Suppose improved methods save $300,000 on a project. If competition then pushes the land purchase price up by $300,000, the investor has handed that improvement to the landowner. The project became more efficient and your return stayed where it was.
My preference is to invest where better acquisition, design and delivery can add to returns, on land whose price has yet to assume every future improvement will arrive.
The question I want investors to ask
The usual question is “How much profit does the pro forma show?”
The better one is “After all costs and taxes, how much more purchasing power will my capital have, and is that enough for the time and risk involved?”
The lever for lower risk and better profit that the construction industry has is time. Time to design, construct and sell. The shorter the time, the better the profit and the lower the risk for the investor. The two-versus-three-year table above is the whole argument in six rows.
That is why VanPlex is inviting a small group of select multiplex builders to join us to cut construction time in half, increase profits, and access an evergreen investment fund for production flow. If you know a builder who should be part of this group, message me on LinkedIn with the word “builder”.
If you own a lot and want to see the return math on it before anyone applies an appreciation assumption, the advanced proforma calculator shows the project at today’s local selling prices, and the investment overview walks through how the equity side is structured. I wrote about the same inflation question for homeowners in Your Home Went Up. Did It Actually Create Wealth?.
David Babakaiff | Co-Founder, VanPlex | PlexRank™ | Profit with Multiplex