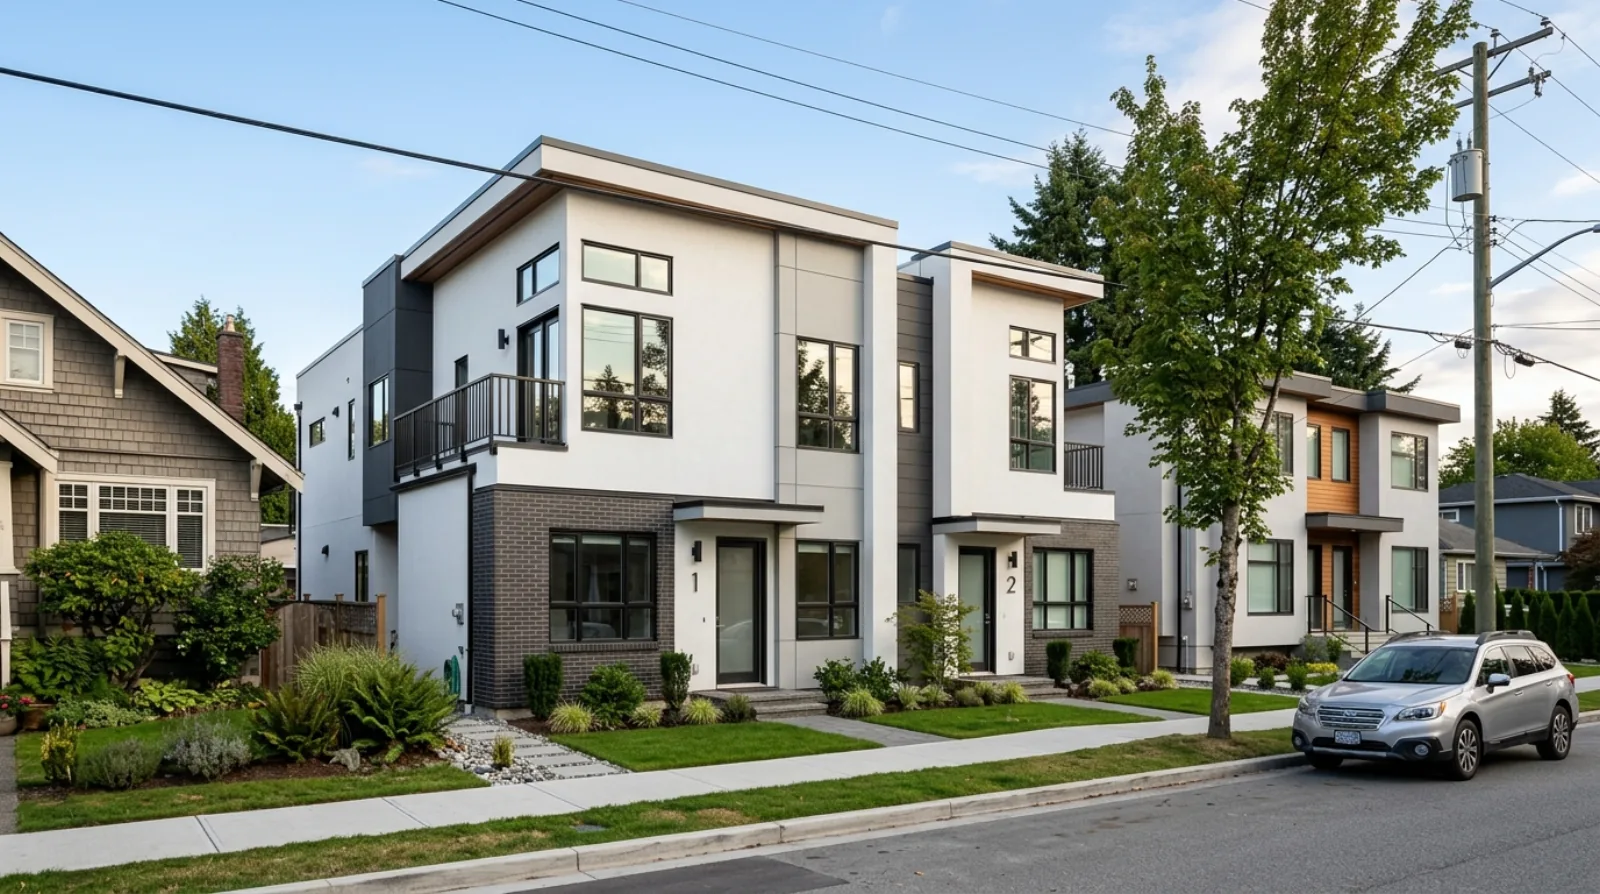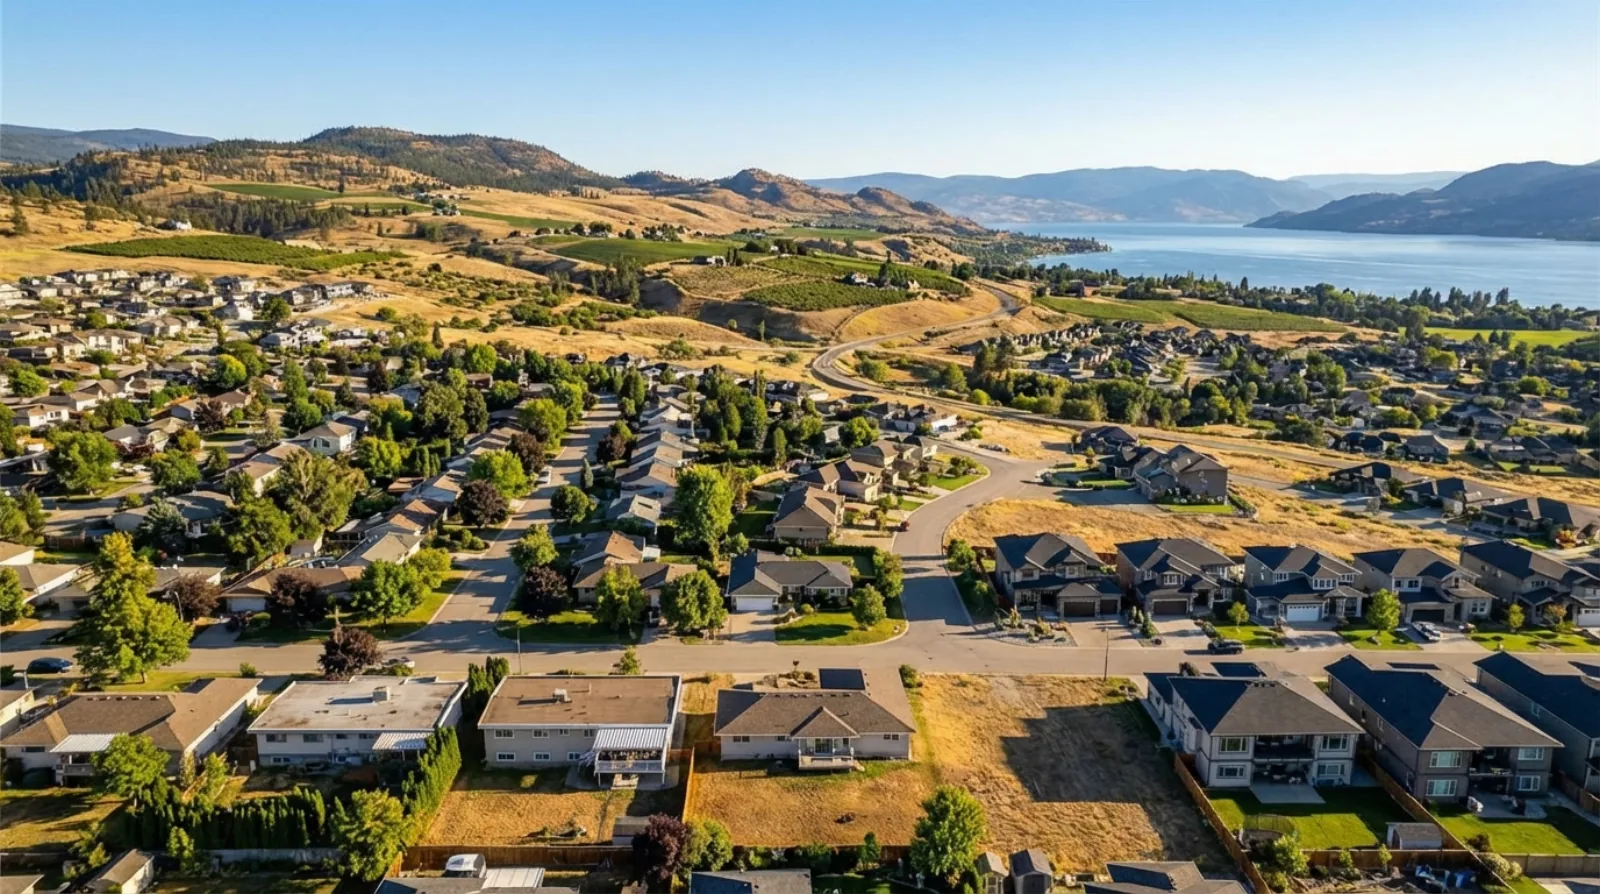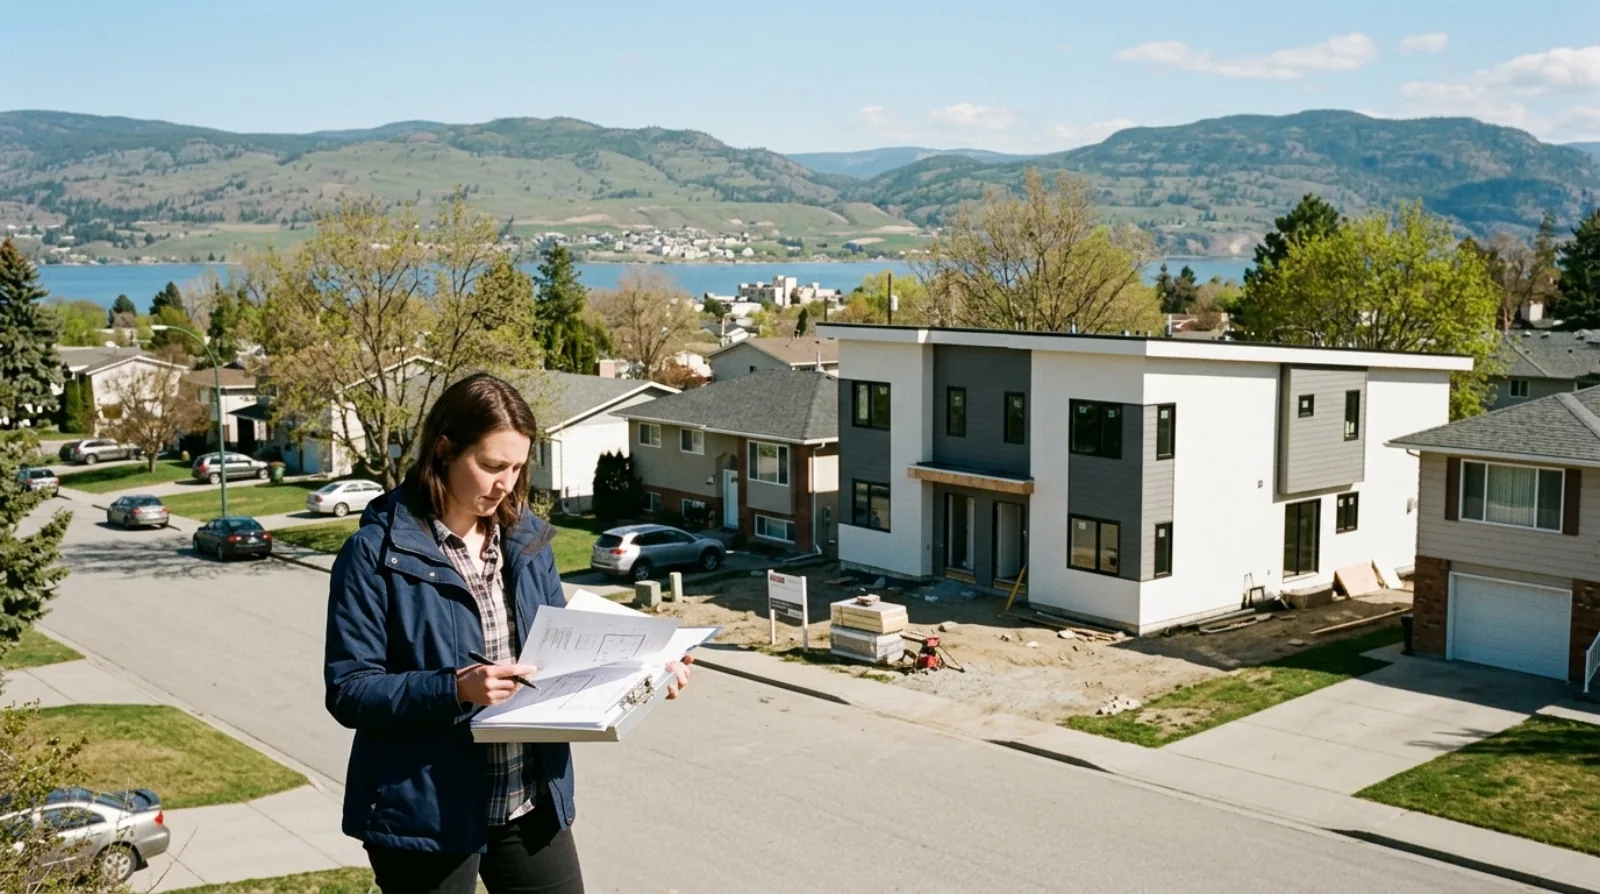

We ran a full development budget on 9,844 Kelowna lots. Most density debates would go better with one.
Arguments about 4 and 6-storey buildings in Kelowna usually trade in adjectives. Too tall, too slow, too expensive, too timid. So we built the thing the argument was missing: a model that runs a complete development proforma, land, construction, city fees, financing, and sale revenue, on every residential lot in the 2040 OCP Core Area, and published it as a free interactive map.
Move a policy slider and 9,844 lots recalculate in about 14 milliseconds. This post is what we learned building it.
What the model tests
Two building types, chosen because BC’s single-egress stair rules (in force August 27, 2024) made both realistic on ordinary lots:
- Arterial 6-storey, single stair. On the 396 lots fronting the Core Area’s arterial corridors: podium parking and a lobby on the ground floor, five floors of homes above, 4 homes per floor per stair. One stair core on every lot, whatever its width, so the cap is 20 homes.
- Core 4-storey. On the other 9,448 residential lots, where Zoning Bylaw 12375 currently allows 3 storeys.
Every lot carries its own facts: dimensions measured from the City’s legal parcel fabric, its 2026 BC Assessment value as the land price, rear lane access from the City’s lane layer, and its frontage class for fee math. The full method is documented on the densification study page.
Two measures, because one number hides the argument
Every lot is scored two ways at the same time, and the map paints both answers on the parcel.
PlexRank ROE is profit divided by the property cost. It answers the owner’s question: what does this return on the money tied up in the land? Under 15% is non-viable, 15 to 35% marginal, 35 to 70% viable, 70% or more strong.
Profit on cost is profit divided by the whole project cost, land plus construction, soft costs, fees and financing. It answers the lender’s question. Under 5% is non-viable, 5 to 15% marginal, 15 to 20% viable, 20% or more strong.
The two disagree constantly, and that is the useful part. At the default settings they land on the same band for 5,026 of the 9,784 scored lots and on different bands for 4,758 of them.
The result at today’s rules
At the model’s defaults, the optimistic Altus cost basis, full Development Cost Charges, and 100% buildout, the Core Area splits like this:
| Band | PlexRank ROE | Profit on cost |
|---|---|---|
| STRONG | 7,812 | 4,260 |
| VIABLE | 1,084 | 2,184 |
| MARGINAL | 288 | 2,604 |
| NON-VIABLE | 600 | 736 |
| No data | 60 | 60 |
Read that carefully before celebrating. Both columns depend on the optimistic construction cost bound. Switch the toggle to the conservative bound, the $365 per sq ft all-in figure from our own built proforma, and the picture inverts: PlexRank ROE keeps 1,182 lots at viable or better and profit on cost keeps none at all, with 9,476 of 9,844 lots turning non-viable. Reality sits between the bounds, which is exactly why the model ships with both.
The three findings that surprised us
Buildout intensity is merciless. On the study’s test lot at 859 Richter St, the arterial 6-storey earns $863,845 at 100% of the allowed floor area, $544,146 at 90%, $255,667 at 80%, and turns negative at 70%. Land, servicing, and frontage works cost the same for a smaller building, so revenue falls faster than cost. A policy that permits 6 storeys but lets process shave 20% off the envelope has quietly deleted most of the profit it granted.
One stair caps a building at 20 homes, and wide lots get punished for it. Four homes per floor across five residential floors is the ceiling no matter how wide the lot is. On a wide arterial lot the 6-storey envelope holds far more floor area than 20 homes can absorb, and the project still pays to build all of it. At full buildout, 250 of the 392 scored arterial lots model a loss for this reason alone. Lowering the buildout intensity until the building matches the homes it can sell turns them profitable again, usually somewhere between 55 and 65%. On a wide arterial lot, maximum permitted floor area is the wrong target.
DCC relief is the City’s largest single dial. Under DCC Bylaw 12930, adopted July 27, 2026, a Main City sector project pays $28,943 per added home at Residential 3 density. The City is running a temporary 25% reduction from August 4, 2026 to September 30, 2028, which brings a Residential 4 home to $20,753.25. On a 12-home infill that line rivals the land cost. Moving the DCC setting from full to waived moves 341 lots into viable or better on PlexRank ROE and 2,076 on profit on cost, more than any other single control.
Parking is a land budget, and it competes with the building. At the bylaw’s 1.0 stall per home, a 12-home project needs roughly 360 m² of yard for surface parking on lots that average about 600 m². Zero minimums exist today only inside the four Transit-Oriented Areas. The full arithmetic is on the policy economics page.
Questions builders and owners ask
How do I check a specific Kelowna address?
Open the Kelowna densification map and type the address into the search box. The map covers all 9,844 residential Core Area lots, flies to the lot, and opens its full budget: homes, city fees, profit, both viability measures, and the maximum land price at a 15% builder margin.
What land price does the model use for my lot?
The model uses each lot’s 2026 BC Assessment total value from City of Kelowna property records. When a property is listed for sale, the model’s pricing rule replaces the assessment with the asking price, and the lot panel on the map lets you type that number in directly.
How accurate are the lot dimensions in the model?
Measured, with the method labeled per lot. No available Kelowna dataset records lot width and depth, so the model measures the City’s legal parcel polygons. 6,266 of the 9,844 lots are four-corner parcels whose edge lengths are exact. The other 3,578 get a fitted rectangle, a visible estimate label, and an editable field to correct them; 2,201 of those fits miss the recorded lot area by more than 10% and are flagged as suspect.
How many Kelowna lots are viable today?
It depends which question you are asking. On PlexRank ROE, 8,896 of 9,844 lots reach viable or better at the default settings. On profit on cost, 6,444 do. Both figures use the optimistic Altus cost basis; on the conservative $365 per sq ft bound the counts fall to 1,182 and zero. That spread is the honest answer, and it is why the model reports both measures and both cost bounds rather than one number.
What is PlexRank?
PlexRank is the return-on-equity measure from the VanPlex proposal to the City of Kelowna: profit divided by the property cost. It is one of the two measures the map scores, alongside profit on cost. The four colour bands, non-viable through strong, are the viability scale that either measure is graded on, and each measure has its own thresholds. The map’s legend counts lots per band on both measures live as you move the policy sliders.
Why does the model put 6 storeys only on arterial corridors?
Because that is the policy scenario the study tests: mid-rise on the streets built to carry it. The 12 candidate corridors, Harvey Ave through Glenmore Dr, follow the City’s 2040 Transportation Master Plan designations and are listed on the arterial corridors page. Any lot can still be switched to the 6-storey test inside its map panel.
Are the city fees in the model the real rates?
The bylaw rates are real and dated: DCC Bylaw 12930 as adopted July 27, 2026, and the Bylaw 7900 Schedule 7 frontage and infill program rates, re-verified on September 2, 2026. That check corrected three Schedule 7 rates the model had been carrying, because the 5% per year escalation applies to every program in the schedule: the local road rate is $3,250 per metre, the infill fire hydrant charge is $1,655, and the infill transit stop charge is $220 per home. Servicing lump sums like water and sanitary upgrades are labeled estimates for the City to confirm, and the map’s fee table marks every line as a bylaw rate, a program rate, or an estimate.
Is this model an appraisal I can take to a lender?
No. It is a planning-level screening tool built to show which policy levers move projects into a viable range across the whole Core Area at once. A lender needs a project-specific proforma with surveyed dimensions, quotes, and current comparables. Use the map to decide which lots deserve that work.
The point of publishing it
A model in a spreadsheet persuades the people who already agree with you. A model anyone can drive persuades the rest. City staff can test the exact relief packages they would have to defend at council; a landowner can look up one address; a skeptic can push every slider to its worst case and see what survives. The numbers argue for themselves at vanplex.ca/kelowna-densification-map.
David Babakaiff is Co-Founder of VanPlex with 25+ years scaling BC construction. He led Alair Homes Vancouver to the 2024 HAVAN Award for Best Multiplex Unit in the GVRD. VanPlex’s PlexRank™ algorithm scores residential parcels across BC for multiplex conversion potential under Bill 44.