
New CCPA research confirms what the data has been saying for 50 years. Housing prices aren’t driven by supply shortages — they’re driven by monetary expansion. Here’s why that makes multiplex conversions the ideal compound investment vehicle.
TL;DR (Key Takeaways)
- Supply isn’t the problem: Canada has 41% more dwellings per person than in 1971 — the housing “shortage” narrative doesn’t match the data
- Money printing drives prices: Home prices track M2 money supply growth — a 108x increase since 1970
- Debt enables financialization: Household debt-to-income has risen from $0.60 to $1.51 per dollar earned
- Wages correlate with housing: Housing has gone “up” in correlation with wage increases — M2 flows to assets
- Build-to-sell beats build-to-rent: In Vancouver, rent-to-cost ratios don’t justify holding; capital recycling creates compound wealth
- PlexRank identifies the opportunity: Out of 56,496 Vancouver homes, only 1,169 show 100%+ ROE — the right-tail matters
What the Study Actually Found
A new study from the Canadian Centre for Policy Alternatives (CCPA) just dropped — and it challenges the single biggest assumption driving Canadian housing policy: that we have a housing supply shortage. It’s a provocative piece written by Niko Block, a PhD candidate at York University.
Mr. Block examined over 50 years of Canadian housing data and arrived at a conclusion that may surprise you: Canada has been building more homes per person, every single decade, since 1971.
In 1971, Canada had roughly 290 dwellings for every 1,000 people. By 2023, that number had risen to over 410.
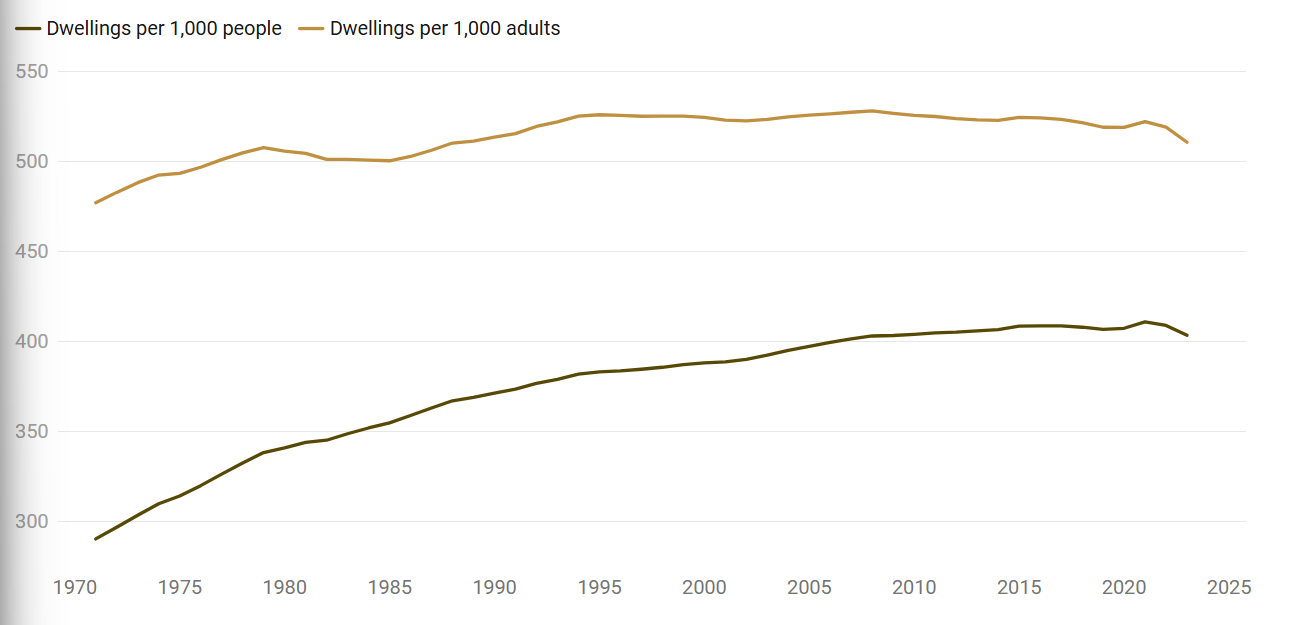
That’s a 41% increase in housing stock per person over half a century, and only just over 7% increase in housing stock per adult. That tells us two things: One — adults are having way less children. And two — the policies and house building so far has not only kept up with the population, but produced more houses per adult, almost exactly one home per two people (Canada-wide stat). Note — that includes new homes and all the old stock built over the decades.
Source: Statistics Canada
Home Prices vs. Income: The Real Gap
At the same time, the average home in 1976 cost less than 3 years of household income. Today, it costs nearly 7 years.
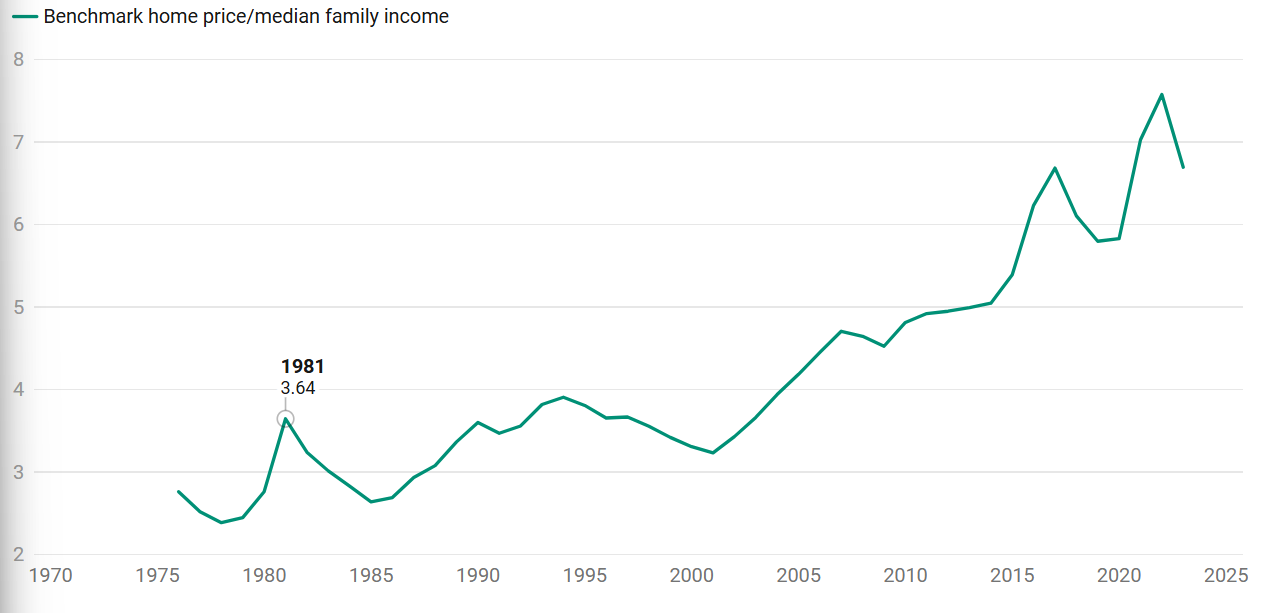
If this were a simple supply problem, that shouldn’t be possible. More supply should mean lower prices. It didn’t.
Source: Statistics Canada
So What IS Driving Prices?
The CCPA blog points to something called financialization — the transformation of housing from a place you live into a financial product you invest in.
Household debt has exploded. In 1976, Canadian households owed about 60 cents for every dollar of annual income. By 2023, that number had risen to $1.51 for every dollar earned. Roughly two-thirds of that debt is mortgage debt.
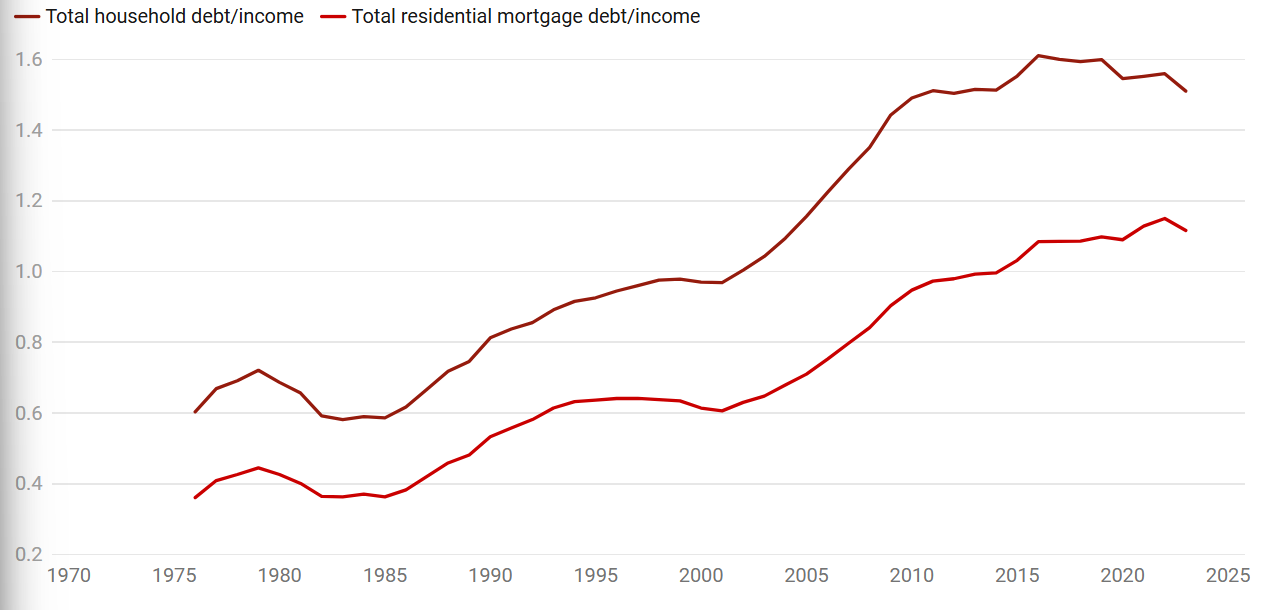
Government-backed mortgage insurance lowered risk for banks, allowing them to lend more aggressively. Down payment requirements dropped from 20% to as low as 5%. Central banks kept interest rates at historic lows for years, which only encouraged more borrowing.
The CCPA’s conclusion is blunt: “The housing crisis is not a crisis of supply; it is a crisis of distribution.” Housing inflation has transferred enormous wealth to property owners — particularly those who own multiple properties with little mortgage debt — while locking out younger Canadians and driving up homelessness.
Source: Statistics Canada
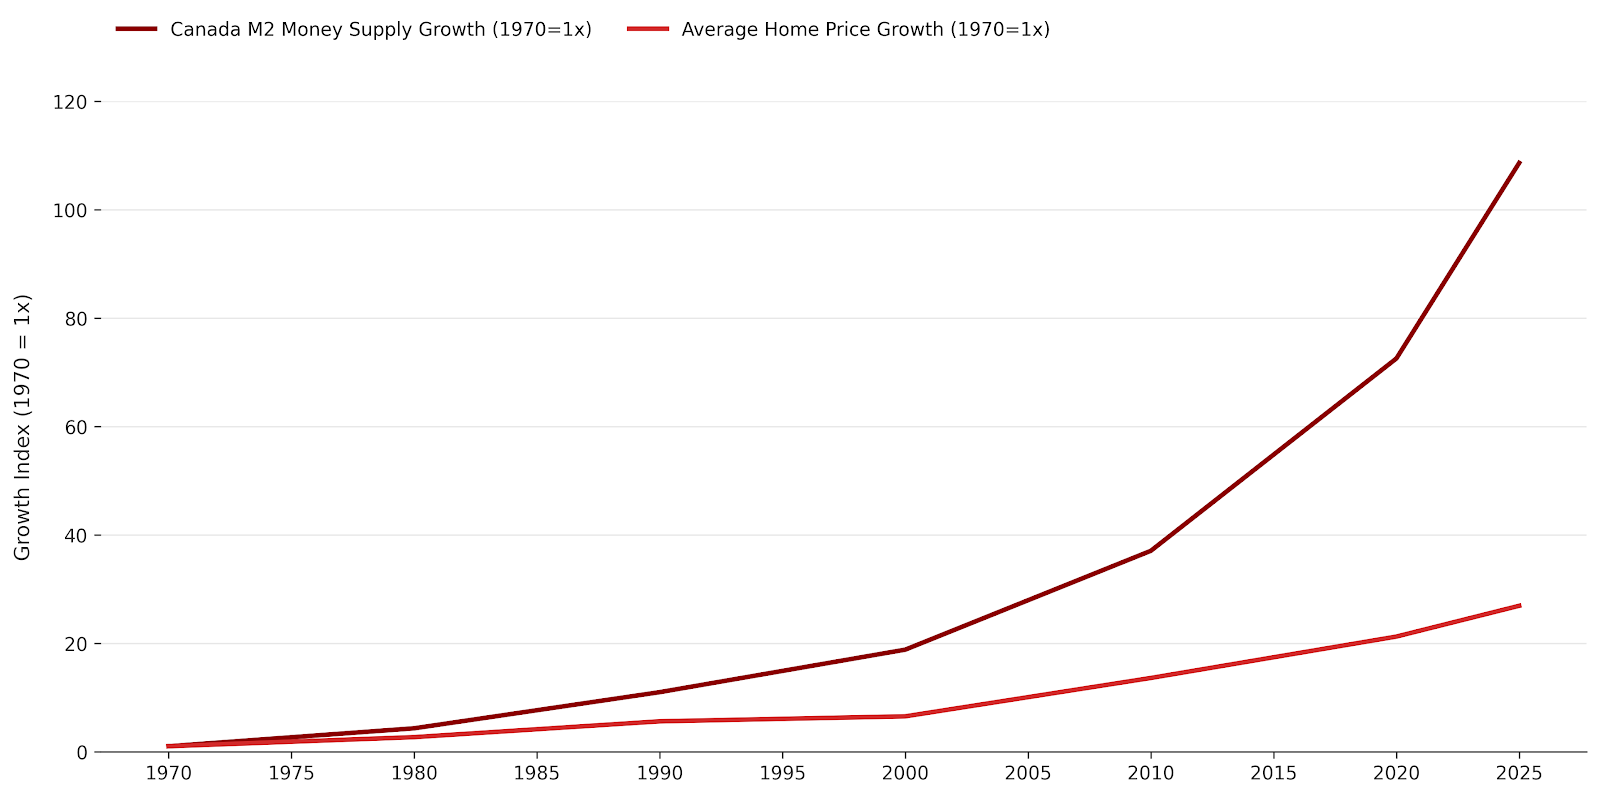
The Graph They’re Not Showing You: Money Supply vs. Home Prices
Here’s where it gets really interesting for investors. I created a chart the CCPA report didn’t include, but that tells the most important part of the story: Canada’s M2 money supply versus average home prices, from 1970 to today.
This chart suggests (I could be wrong!) that the M2 money supply found its way into assets like stock market, gold, real estate (industrial, commercial and residential) as an example. The only reason the price of homes did not rise more is because the average wage people earned over that same time.
Source: Bank of Canada Monetary Aggregates tables
Canada M2 Money Supply vs. Average Home Price (1970–2025)
| Year | M2 Money Supply (CAD Billions) | Avg Home Price (CAD) | M2 Growth (1970=1x) |
|---|---|---|---|
| 1970 | ~$25.5B | ~$25,000 | 1x |
| 1980 | ~$110B | ~$67,000 | 4.3x |
| 1990 | ~$280B | ~$140,000 | 11x |
| 2000 | ~$480B | ~$163,000 | 19x |
| 2010 | ~$945B | ~$340,000 | 37x |
| 2020 | ~$1,850B | ~$531,000 | 73x |
| 2025 | ~$2,770B | ~$673,000 | 108x |
Since 1970, the M2 money supply — essentially the total amount of dollars in the Canadian economy — has grown roughly 108 times over. Home prices have grown about 27 times in the same period.
Key Insight: Housing has gone “up” in correlation with wage increases. When the government creates more money, that money flows into assets. It’s possible that the housing price has gone up (M2 flow to personal real estate) only as much as wages rose.

Source: Consumer Price Index and Statistics Canada
What This Means for Multiplex Investors
If housing prices are fundamentally driven by monetary expansion — not just supply and demand — then owning real estate isn’t just a good investment. It’s a hedge against the ongoing erosion of your investment and purchasing power.
The best way to capture this isn’t by holding rental property. It’s by building and selling — explicitly multiplex.
Why Build-to-Sell Beats Build-to-Rent
In Vancouver, the math on build-to-rent is punishing. To acquire a single-family lot and convert it into a multiplex, the costs are not covered by the rental capacity or NOI. If you hold that building as a rental, your net operating income (after mortgage payments, taxes, insurance, and maintenance) traps around $2 million in a single asset for years before you see meaningful returns.
The rent-to-cost ratio in Vancouver simply doesn’t justify it for most investors. Your capital is locked up. Your returns are slow. And you’re carrying all the risk of a single property for a long time.
The build-to-sell model changes everything.
The VanPlex Compound Loop
Here’s how VanPlex’s model works, and why it creates a compounding return cycle:
Step 1: Identify — PlexRank finds the highest-ROE properties
Our AI-powered PlexRank system analyzes all city-wide single-family homes in Vancouver (and each city we operate in) and ranks them by projected return on cost of lot (ROE) for multiplex conversion. The results are striking — and you can see them in the chart below.

Vancouver PlexRank Q1 2026 — ROE Distribution Across 56,496 Homes
Out of 56,496 homes analyzed, 1,169 properties show projected ROE of 100% or higher. The mean ROE across all homes is 19.2%, with a median of 15.0%. VanPlex focuses on the far right tail of this distribution — the properties where the conversion opportunity is most compelling.
Step 2: Build Fast — Collapse the investment timeline to under one year
Traditional timelines in Vancouver to permit and build a multiplex stretch 18–24 months or longer. Every month you’re carrying costs on land and construction financing, your returns shrink. VanPlex’s fast construction methodology — using modern building systems and streamlined permitting — compresses the build cycle to under 12 months from acquisition to completed units.
Shorter timelines mean lower carrying costs, less exposure to interest rate risk, and faster capital recycling.
Step 3: Sell — Capture the profit and free the capital
By selling the completed multiplex units, you crystallize your return immediately. No waiting years for rental income to compound. No $2 million trapped in a building. The profit is realized, the capital is returned, and it’s ready to deploy into the next project.
Step 4: Repeat — The compound loop
This is where the real power is. Each completed project returns your capital plus profit. That larger pool of capital goes into the next PlexRank-selected property. And the next. Each cycle, the base grows. That’s compounding — not from sitting on a rental, but from actively cycling capital through high-ROE conversions at speed.
THE VANPLEX COMPOUND LOOP

PlexRank Select (100%+ ROE) → Acquire → Build Fast (<12 months) → Sell → Return Capital + Profit → Repeat

Each cycle grows the capital base. Shorter timelines = more cycles per decade = higher compound returns. This is the engine.
Key Insight: Capital Compounding Loop beats Project Profits The standard real estate investment model is project focused. Hunt for a good deal and execute. Bill 44 and multiplex is a new strategic asset class with scale potential. Combine PlexRank and factory-based housing modules capacity and it’s a programmatic capital compounding loop that happens to build housing.
Why This Works in the Current Environment
The CCPA’s findings actually strengthen the build-to-sell multiplex thesis. Here’s why:
The price floor is structural, not cyclical. Canada already has more homes per person than 50 years ago, and prices are still high because of financialization and monetary policy. That means the forces propping up property values aren’t going away. When you build and sell, you’re selling into a market with a structurally supported price floor.
You’re buying in today’s dollars and selling in tomorrow’s (cheaper) dollars. Every time the Bank of Canada expands the money supply, the value of existing real estate adjusts upward. Your construction costs are locked in at today’s prices. Your sale price reflects the market at completion — which, if history is any guide, will be higher.
Speed reduces risk. A 12-month project cycle means you’re exposed to market volatility for a fraction of the time compared to a buy-and-hold rental strategy or traditional multifamily builds. If conditions shift, you’re already out. If they improve, you cycle into the next one faster.
Government policy is pushing demand toward exactly what we’re building. BC’s Bill 44 has legalized small-scale multi-unit housing on single-family lots across the province. Federal and provincial programs are incentivizing this type of construction. We are building the product that policy is designed to encourage, and selling it into a market of buyers who want exactly this type of housing.
The Bottom Line
The CCPA study is a wake-up call for policymakers. But for investors, the data tells a different story — one of opportunity.
The forces driving housing prices — monetary expansion, financialization, government-backed credit — aren’t going away. If anything, they’re accelerating. The question isn’t whether housing will remain expensive. Fifty-five years of data tells us it will.
The question is whether you’ll compound your capital on the right side of that equation.
At VanPlex, we use PlexRank to identify the highest-ROE conversion opportunities, fast construction methods to compress timelines, and a build-to-sell model that frees your capital for the next cycle. That’s the compound loop.
Sources
- Canadian Centre for Policy Alternatives — “The Numbers Don’t Lie” (2025)
- Bank of Canada M2 Monetary Aggregates
- CREA National Average Home Prices
- Statistics Canada Census Data
- VanPlex PlexRank Analysis Q1 2026
David Babakaiff is the Co-Founder and CEO of VanPlex, a Vancouver-based company specializing in multiplex development and Missing Middle housing. VanPlex uses its AI-powered PlexRank system to identify and underwrite multiplex conversion opportunities under BC’s Bill 44 zoning reforms.
Want to see the PlexRank analysis for a specific property? Visit VanPlex.ca to check your property’s potential.