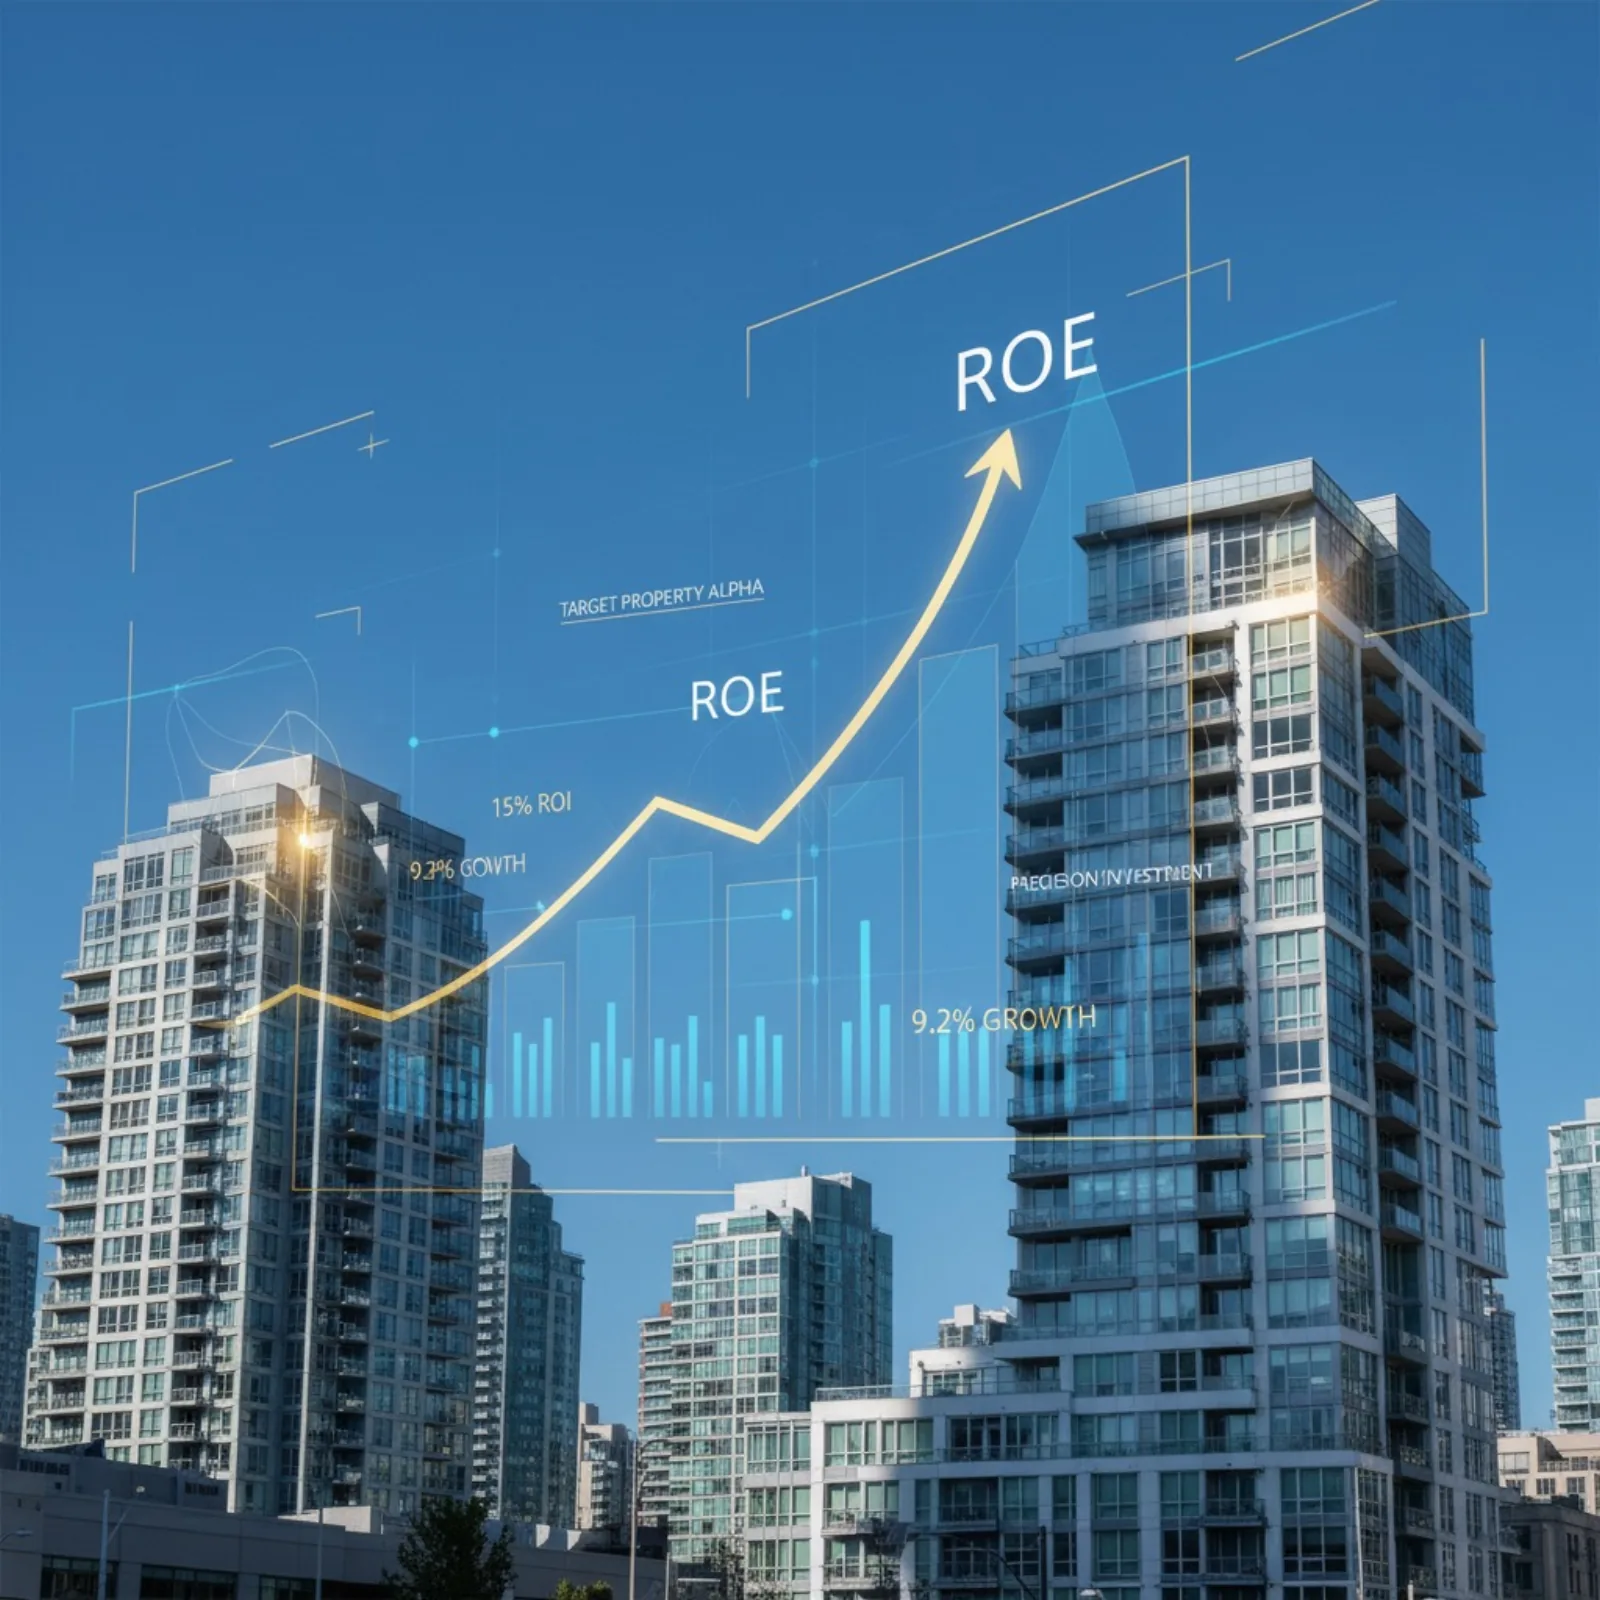

Only 2% of the 90,000 rezoned multiplex lots in Greater Vancouver deliver 100%+ ROE—the threshold that justifies development risk in today’s high-cost environment. VanPlex’s PlexRank analysis reveals that Vancouver’s median ROE is just 15%, while combined Vancouver-Burnaby achieves only 20%. The era of general multiplex optimism is over; precision investing using proprietary data is the only viable path forward.
TL;DR (Key Takeaways)
- 90,000 homes rezoned under GVRD multiplex policies (Vancouver R1-1, Burnaby R1 SSMUH)
- Vancouver median ROE: ~15% (dangerously close to minimum viability threshold)
- Vancouver-Burnaby combined median ROE: ~20%
- Only ~25% of rezoned properties are financially lucrative with standard execution
- Only ~2% of lots deliver 100%+ ROE—the true investor-grade opportunities
- Vancouver’s 1.25 FSR advantage (Net Zero + exclusions) is the key profit multiplier
- Burnaby’s recent policy changes reduced GFA by 33-45% on smaller lots
- PlexRank by VanPlex identifies the exact addresses worth pursuing
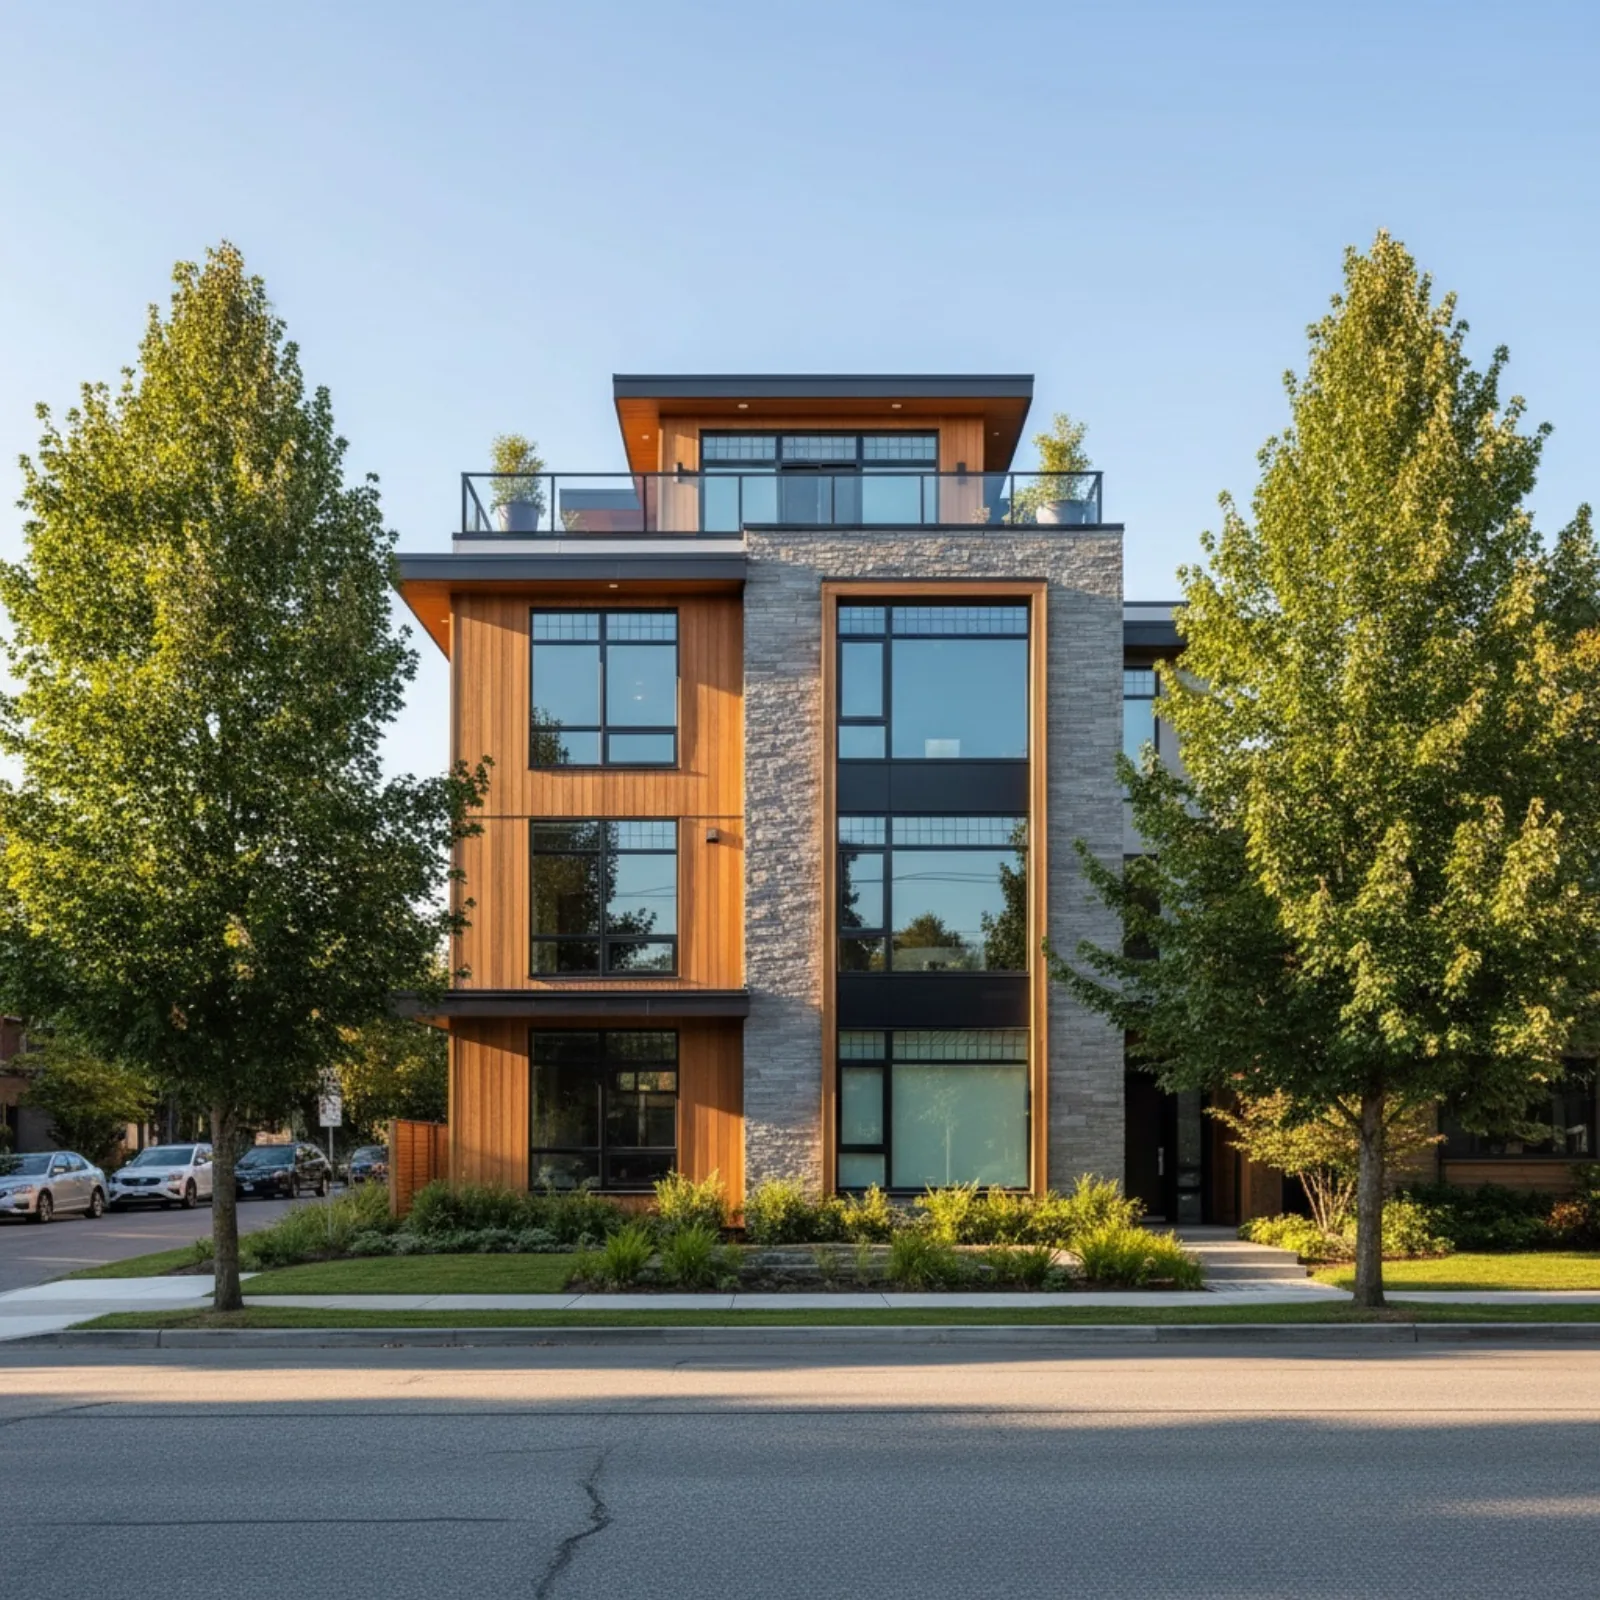
Zoning is a Volume Play—Profit is a Precision Game
The Greater Vancouver Regional District (GVRD) multiplex policies—Vancouver’s R1-1 and Burnaby’s R1 SSMUH—have rezoned close to 90,000 homes. This is the Volume. But for investors, the only number that matters is the Return on Equity (ROE), the return on the value of the property.
The reality, proven by VanPlex’s PlexRank Analysis, is eye-opening:
| Market | Median ROE | Assessment |
|---|---|---|
| Vancouver (R1-1) | ~15.0% | Dangerously close to minimum viability |
| Vancouver + Burnaby Combined | ~20.0% | Still below institutional threshold |
| Target for Investment-Grade | 100%+ | Only ~2% of properties qualify |
Vancouver’s median ROE of ~15% is dangerously close to the minimum threshold required to justify the risk of a multi-unit project with today’s high soft costs and construction costs (often $2.3M-$3.5M for the build alone).
Even including Burnaby, where land coverage and construction costs are often slightly more favourable, the median ROE is only 20%.
The political narrative focuses on supply. Your focus must be on viability. VanPlex analysis shows that only about one-quarter (25%) of rezoned properties in these two major markets are financially lucrative with standard execution.
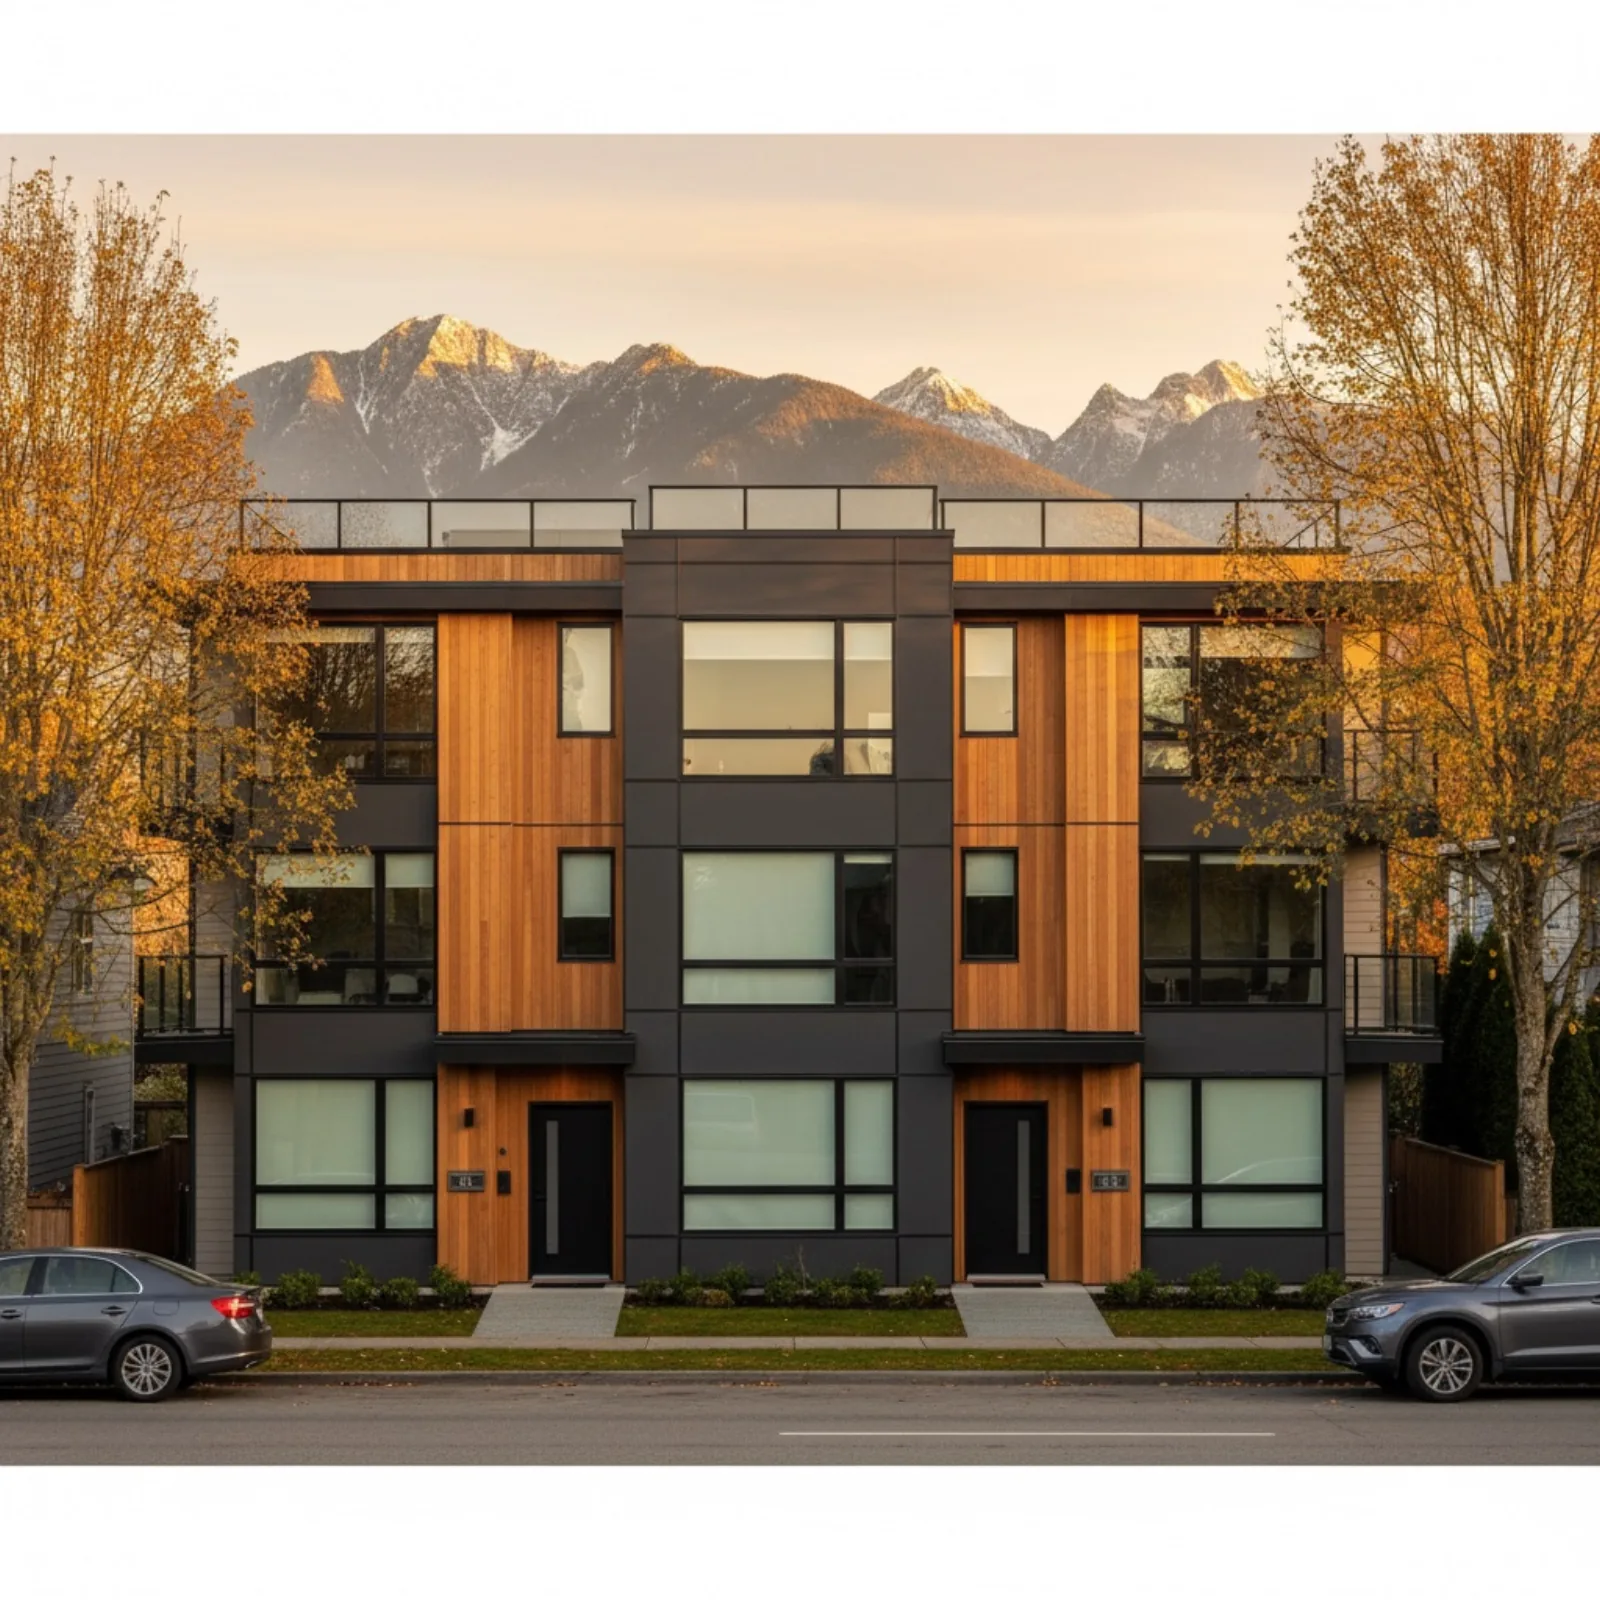
The 1.25 FSR Vancouver Profit Multiplier
In Vancouver, the difference between a break-even project and a home run is found in the FSR mechanics—the Floor Space Ratio. Most builders stop at the 1.0 FSR maximum obtainable via the Density Bonus payment. This places them squarely in the 15%-45% ROE range.
The 2% Gold Standard:
The properties that achieve 100%+ ROE—the true game-changers—unlock the hidden FSR:
- 1.25 FSR Advantage: Achieved by pursuing Net Zero Energy standards and strategically utilizing specific density exclusions granted by the City of Vancouver (CoV) for technical construction features
- The Cost-to-Value Arbitrage: This specialized design expertise yields a massive increase in sellable square footage (up to 25% over 1.0 FSR)
Crucially, this additional square footage does not attract Density Bonus charges or DCL charges, decreasing the proportional cost of land per saleable square foot.
| FSR Strategy | Typical ROE Range | % of Builders Using |
|---|---|---|
| Standard 1.0 FSR | 15%-45% | ~95% |
| Net Zero 1.25 FSR | 100%+ | ~5% |
Hard-Hitting Takeaway: If your pro forma doesn’t incorporate the maximum CoV exclusions and the Net Zero bonus (which has a deadline for applications), you are leaving the only significant profit on the table.
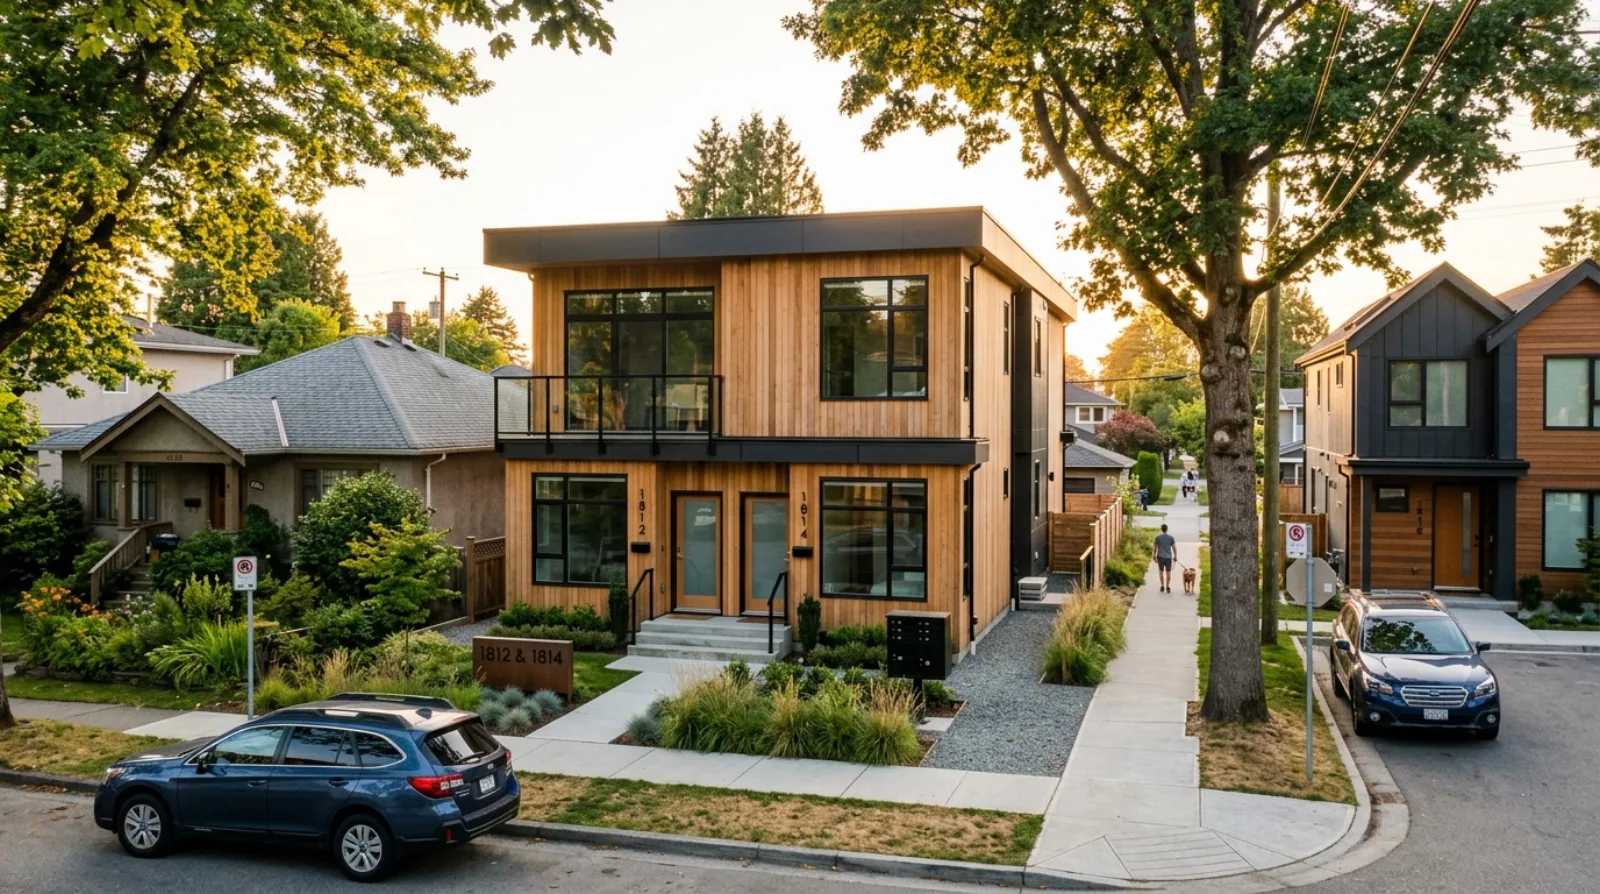
Burnaby’s Policy Friction: The Shrinking Envelope
While Vancouver’s challenge is about maximizing FSR, Burnaby’s R1 SSMUH struggle is about defending the building envelope against policy risk.
Recently, NIMBY-driven backlash has had a tangible effect. Oversized box-like structures triggered a public-led change to multiplex sizing rules. The push to reduce height from four to three storeys (10m max) and reduce lot coverage represents a direct cut to achievable floor area.
Impact on Gross Floor Area (GFA):
| Lot Type | Pre-Policy Change | Post-Policy Change | GFA Reduction |
|---|---|---|---|
| Small Lots | 12,000 sq ft potential | 7,900 sq ft or less | 33-45% |
| Larger Lots | Market-sized units | Still viable | Minimal |
The Land Cost Squeeze Nuance:
The new policy’s negative effect is concentrated on smaller lots. Burnaby’s bigger lots technically penciled out at 12,000 square feet of building, but market realities (unit sizes too large and expensive) already required cutting back to ~7,900 sq ft.
For smaller lots, the land cost per buildable square foot has increased significantly. You must filter for lots that inherently work within the new, tighter 3-storey envelope without relying on aggressive height or lot coverage limits that were subsequently rolled back.
Parking Headache: The push to increase parking minimums from 0.67 to 1 stall per unit adds significant non-revenue-generating space and cost to the pro forma, especially when not near a Frequent Transit Network (FTN) area.
The Time for General Optimism is Over
This is a market for surgical precision. As an investor, your goal is to find the ~2% of lots that deliver the 100% ROE returns that truly justify the risk.
This requires proprietary data and specialized design knowledge—not just basic zoning maps and construction approaches like “a duplex with a laneway and call it good.”
What Separates the 2% from the 98%:
- Geometry: Frontage, depth, and corner lot advantages
- FSR Optimization: Net Zero certification + CoV exclusions
- Market Timing: Understanding policy windows and deadlines
- Pro Forma Precision: Full accounting of DCLs, DCCs, soft costs, and realistic sales prices
PlexRank by VanPlex transforms the investment approach from hunting for good deals to pre-knowledge of the exact address—avoiding the 85% of properties that would produce marginal results or even losses.
How Much Does Multiplex Development Cost in Vancouver?
The total cost to develop a multiplex in Vancouver ranges from $2.3M to $3.5M for a typical fourplex to sixplex. This breaks down to:
| Cost Category | Range |
|---|---|
| Construction | $1.8M-$2.8M ($400-500/sqft) |
| Design & Permits | $150K-$250K |
| City Fees (DCL, DCC, Density Bonus) | $400K-$600K |
| Soft Costs & Contingency | $150K-$300K |
The math only works when end value exceeds 4X development cost. This is why precision in property selection is non-negotiable.
Your Next Steps
To identify properties in the 2% investment-grade category or learn how you can participate in VanPlex’s next 100% profit project:
Visit VanPlex.ca to:
- Check your property’s eligibility and ROE potential using the advanced proforma calculator
- Access PlexRank data for Vancouver and Burnaby
- Connect with specialized multiplex development partners
- Explore co-investment opportunities
David Babakaiff Co-Founder, VanPlex PlexRank | Profit with Multiplex