Monitoring & Policy | Peer Benchmarking
How does your city compare to its neighbours?
Two questions, side by side: what rules did each municipality set, and what did those rules actually produce? The first is public regulation. The second is where VanPlex's analysis adds the part nobody else has.
The rules each city set
Public SSMUH bylaw and fee facts across BC municipalities. Similar headline rules, very different fine print.
| Municipality | Base units | Near frequent transit | Parking near transit | Fee posture |
|---|---|---|---|---|
| Vancouver | 6 strata | 8 secured rental | Reduced / none on qualifying lots | Density-bonus cost above 0.70 FSR; rental waivers in play |
| Burnaby | 4 | 6 (within 400 m of frequent bus) | None required within 400 m of frequent bus | Full DCC/ACC; case-by-case waiver bylaw (Sep 2024) |
| Surrey | 4 | 6 (≈18% of eligible lots qualify) | None required in frequent-bus areas | DCCs rolled back to 2023 levels; instalments from Jan 2026 |
| Richmond | 4 | 6 (within 400 m of frequent bus) | None required near frequent bus | DCCs charged per lot, not per unit |
| Coquitlam | 4 | 6 (near frequent transit) | Reduced near Evergreen Line | ≈$41,448 per unit multiplex DCC (Jun 2025) — among the highest |
| New Westminster | 4 | 6 (≈1,100 lots pre-zoned) | Reduced / none near SkyTrain | DCC Bylaw 8327 (Jan 2026) + Metro apartment-rate DCCs |
| Kelowna | 4 | 6 (near frequent transit) | Reduced near frequent transit | Infill Fast-Track: pre-approved designs to permit in ~10 business days |
What those rules produced
The same PlexRank analysis, three different cities. Burnaby, North Vancouver, and Kelowna each show a distinct viability shape — driven by land cost and lot geometry as much as by zoning. Compare the spread, the break-even line, and how heavy the right-hand tail is.
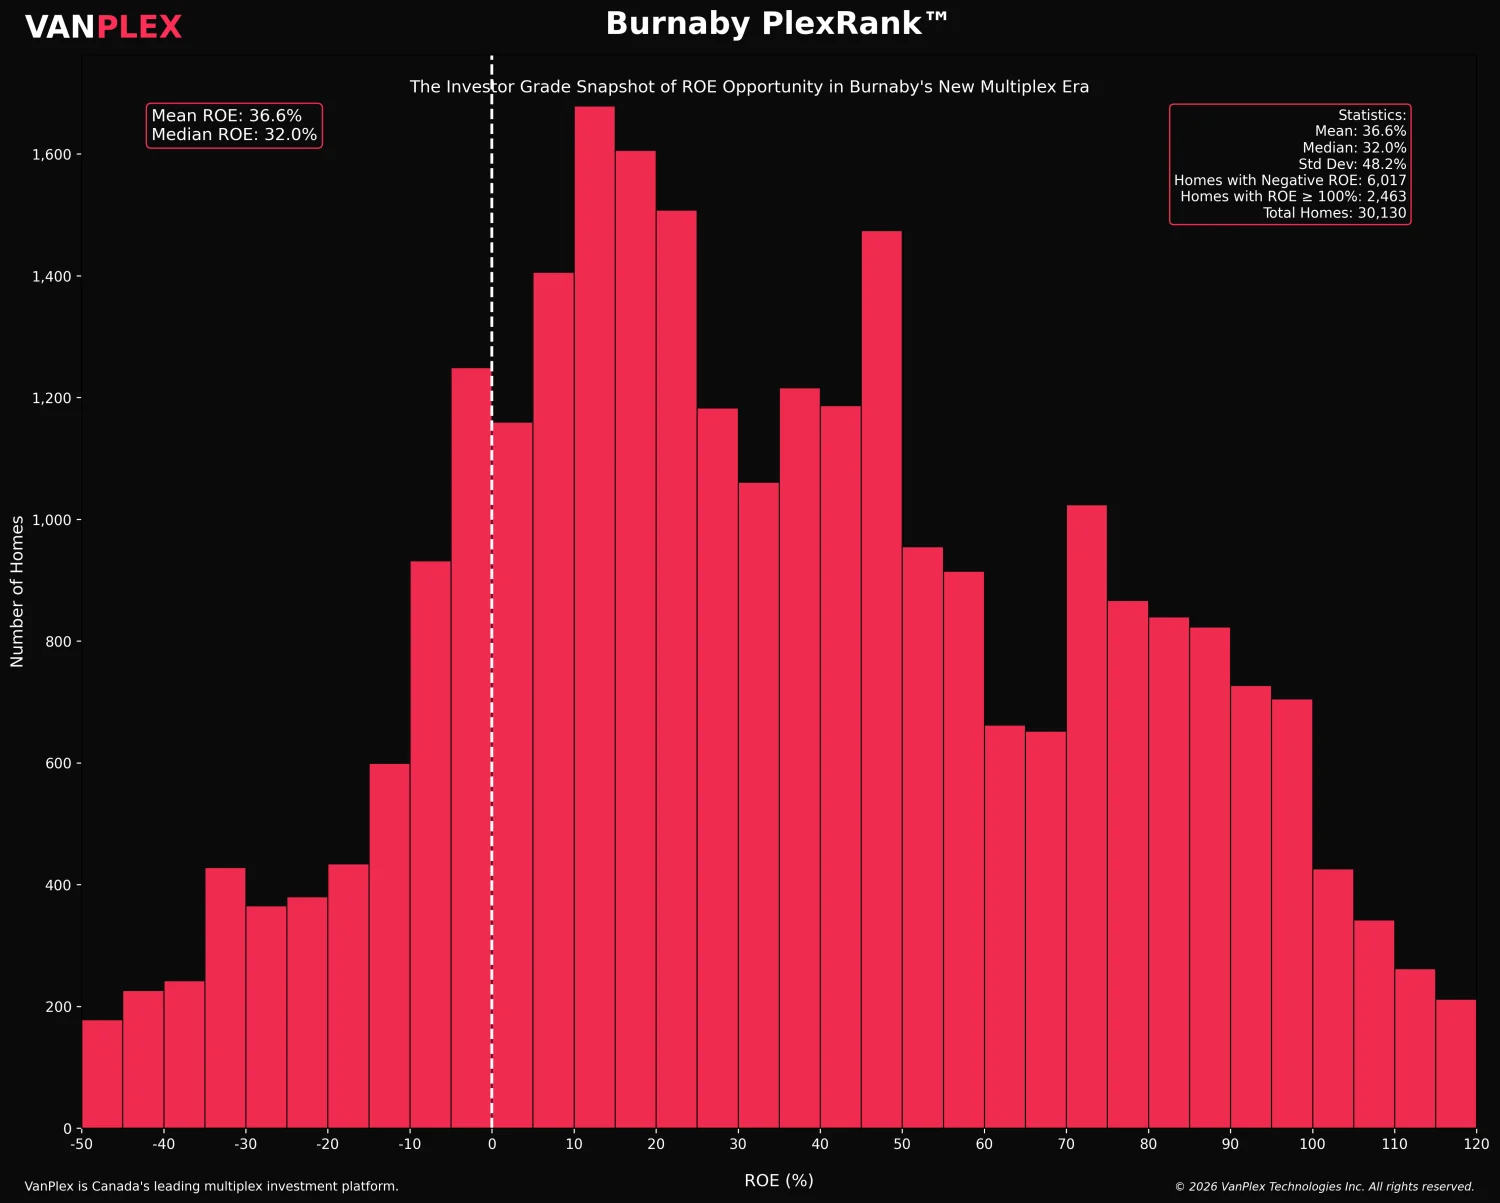
Real VanPlex PlexRank™ analysis.
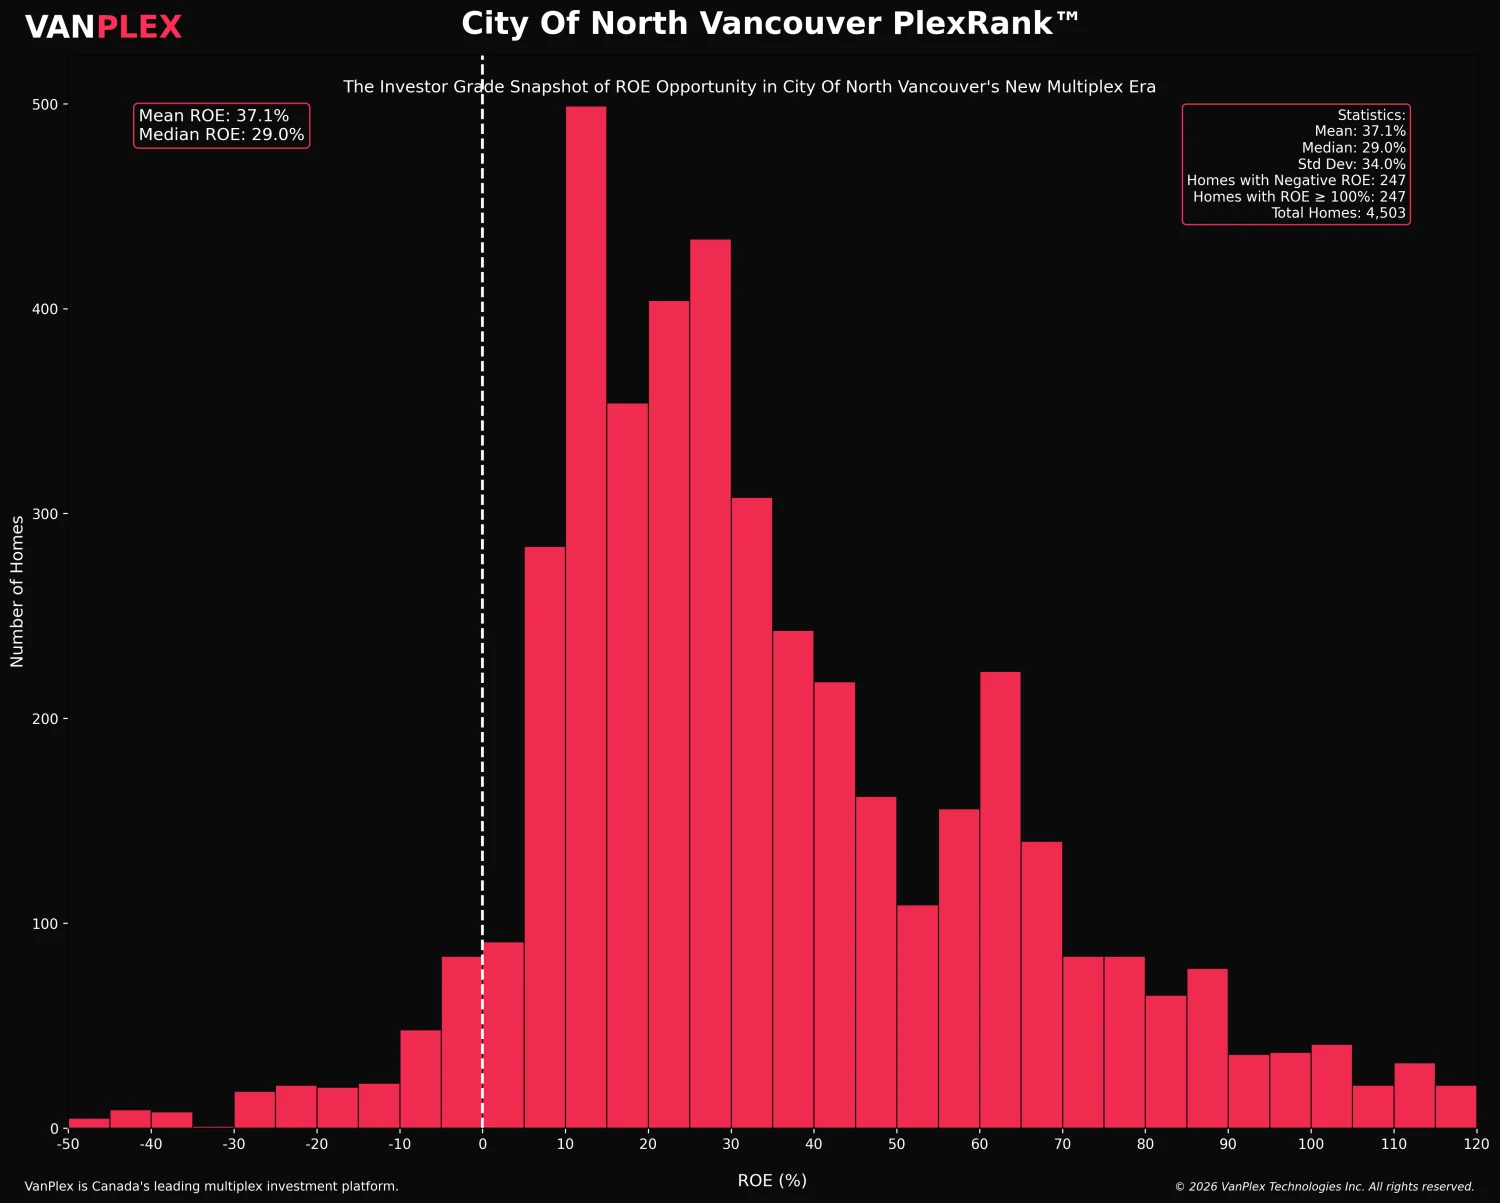
Real VanPlex PlexRank™ analysis.
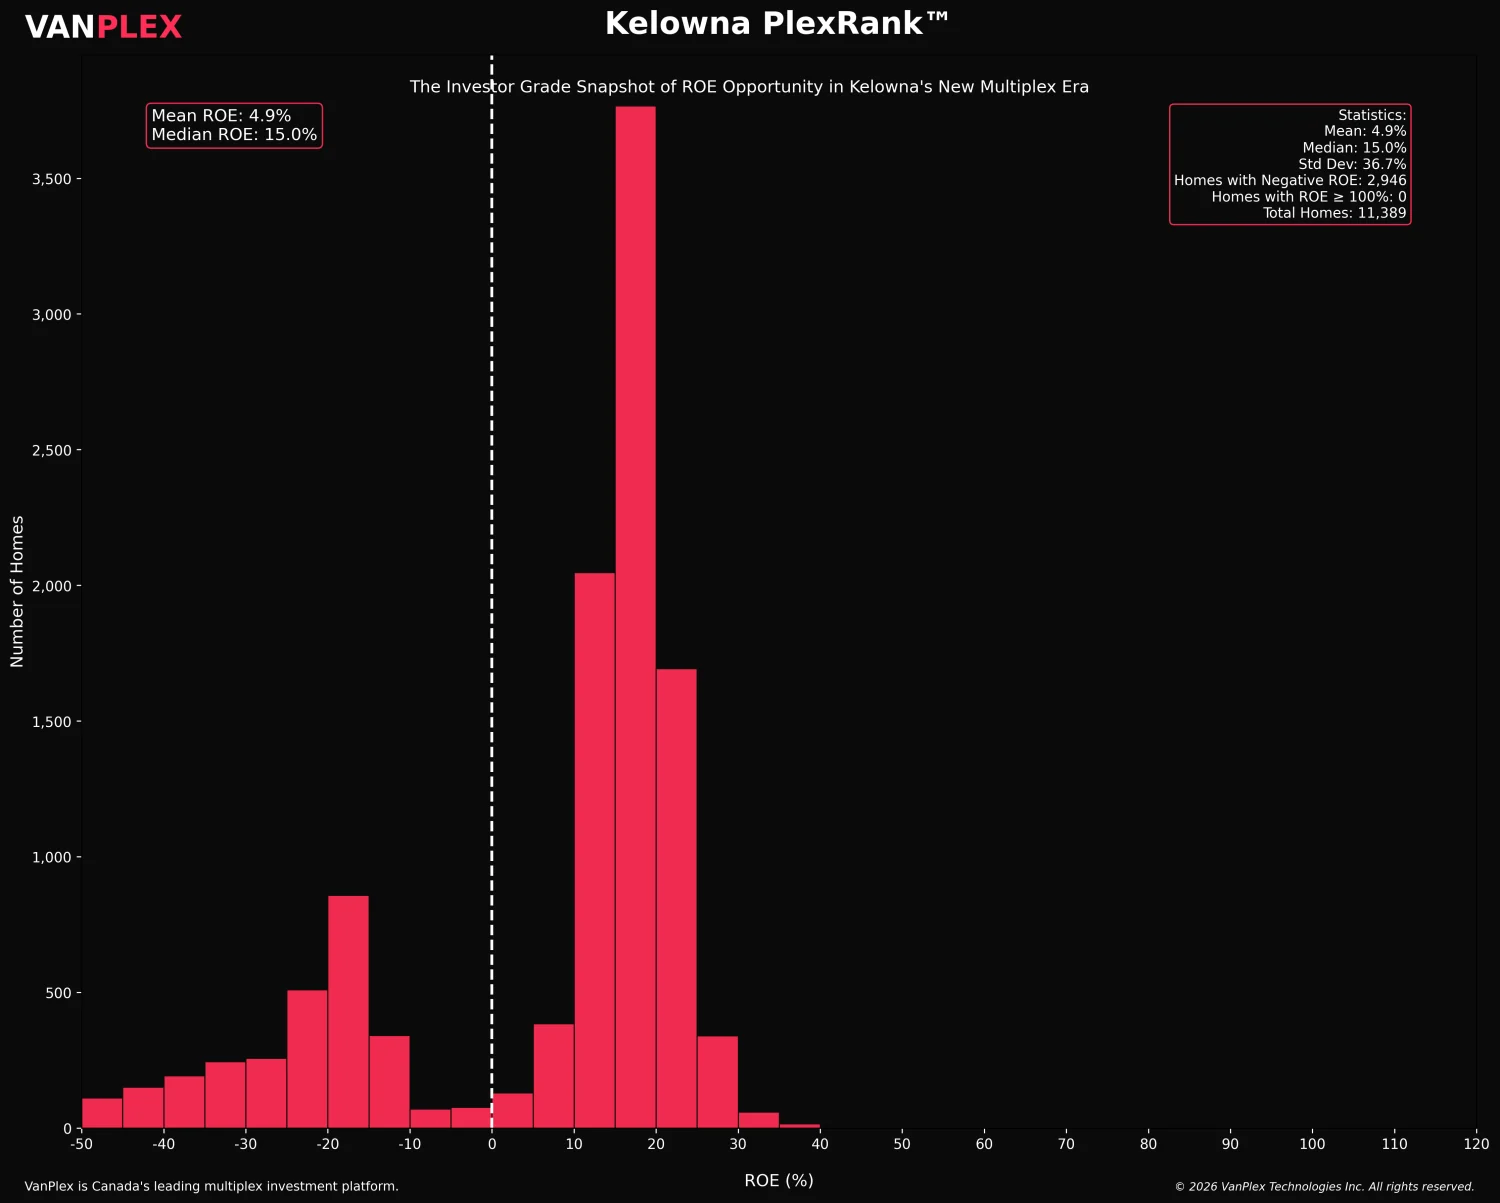
Real VanPlex PlexRank™ analysis.
Add your city to the benchmark
We place your municipality next to its neighbours on both the rules and the real feasibility outcome — so you can see where you actually stand.
- Your city's rules in the comparison table
- Your own PlexRank distribution beside your neighbours'
- Permit-uptake comparison across the peer group
- A clear read on whether your settings are an outlier
Frequently asked questions
Where do the bylaw figures come from?
What is the difference between the rules and the charts?
Can you put my city in the comparison?
Want this for your municipality?
We already track multiplex permit uptake and lot-by-lot feasibility across BC. Tell us your city and we'll show you what your data says — and how a monitoring partnership works.