For BC City Planners
Is your rezoning actually producing housing?
Bill 44 made every BC municipality over 5,000 people allow 3–6 units on single-family lots. The hard question now is whether those rules are producing permits — or sitting idle. VanPlex tracks the answer, and the reason behind it: the density level where a multiplex actually pencils for a builder.
The core problem we solve
The density that actually gets built
Deciding how much density to grant is the hardest call a planner makes. Two different failures sit on either side of the right answer. VanPlex measures the financial-viability side — lot by lot — so you can set the dial where housing actually gets built.
Density too low
Nothing gets built
Below a certain number of units, a multiplex can't cover land plus construction. Builders walk. The lot stays a single house and the upzoning produces no housing.
The viable range
Homes actually get built
Enough units that the project clears a builder's return threshold — so permits get pulled and units get delivered. This is the band you're trying to hit.
Density too high
Infrastructure can't take it
Past a point, servicing, traffic, and community capacity can't absorb the density — and council and neighbours push back. The plan stalls for a different reason.
What financial viability looks like across a city
This is real VanPlex PlexRank™ analysis for Metro Vancouver — every R1 lot scored on the return a builder would earn. Most lots sit near or below the line where a project gets built. The tail to the right is where permits actually come from. We build this exact picture for your city.
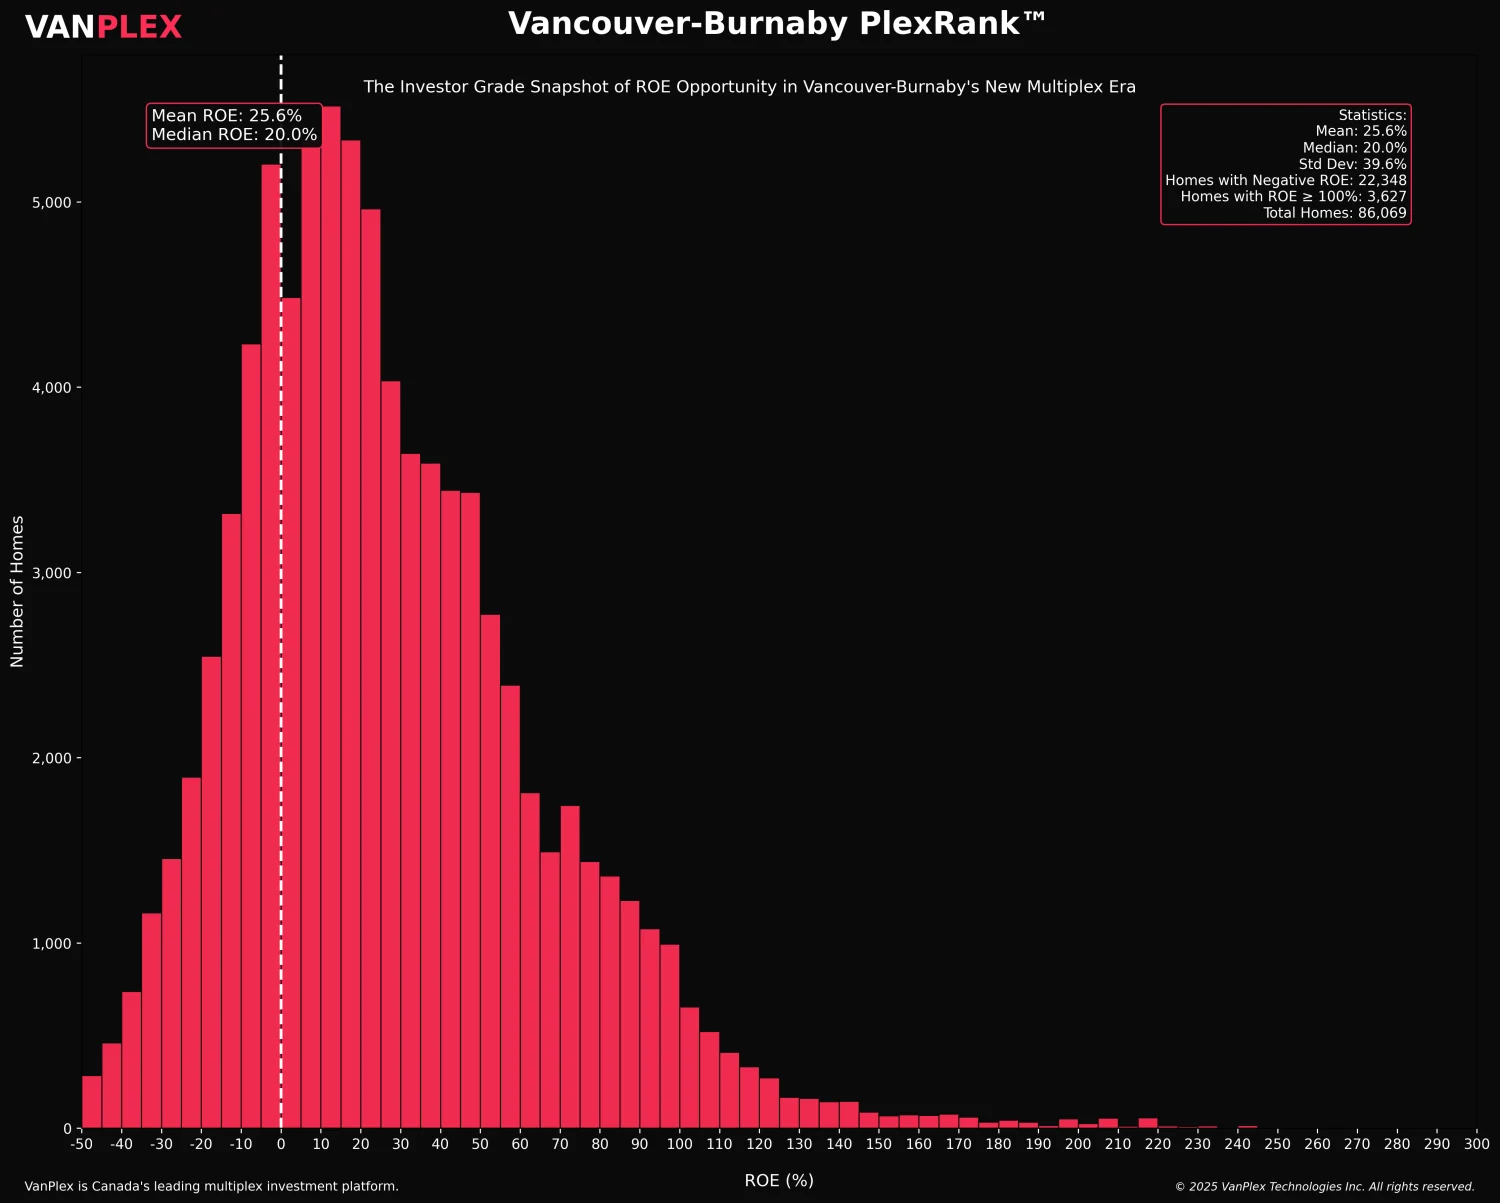
Each bar is the number of lots at a given projected return. The dashed line marks break-even — lots to the left lose money and never get built.
Vancouver + Burnaby R1 lots. Your city's distribution is prepared as part of a monitoring partnership.
Who this is for
Director of Planning
You set the rules and answer to council. You need to know if the upzoning is working.
See permit uptake →Housing Needs Report analyst
You have to report units, housing near transit, and what's being done about it.
Map your HNR data →Policy / zoning staff
You're deciding how much density to grant. Too little does nothing; too much breaks things.
Find the viable range →Explore the hub
Get the monitoring picture for your municipality
We already run permit-uptake and viable-density analysis across BC. We'll build it for your city and walk your team through what it shows.
- Your multiplex permit pipeline — counts by type, status, and trend
- The share of your lots that pencil today, and what moves it
- Your full PlexRank return distribution
- Benchmarking against your neighbouring municipalities
- Data mapped to your Housing Needs Report sections
Frequently asked questions
What does VanPlex actually monitor for a city?
Why does feasibility matter to a planner, not just a developer?
Is the data on these pages my city’s data?
How does this connect to Housing Needs Reports?
What does it cost to start?
Official Sources Referenced
Want this for your municipality?
We already track multiplex permit uptake and lot-by-lot feasibility across BC. Tell us your city and we'll show you what your data says — and how a monitoring partnership works.