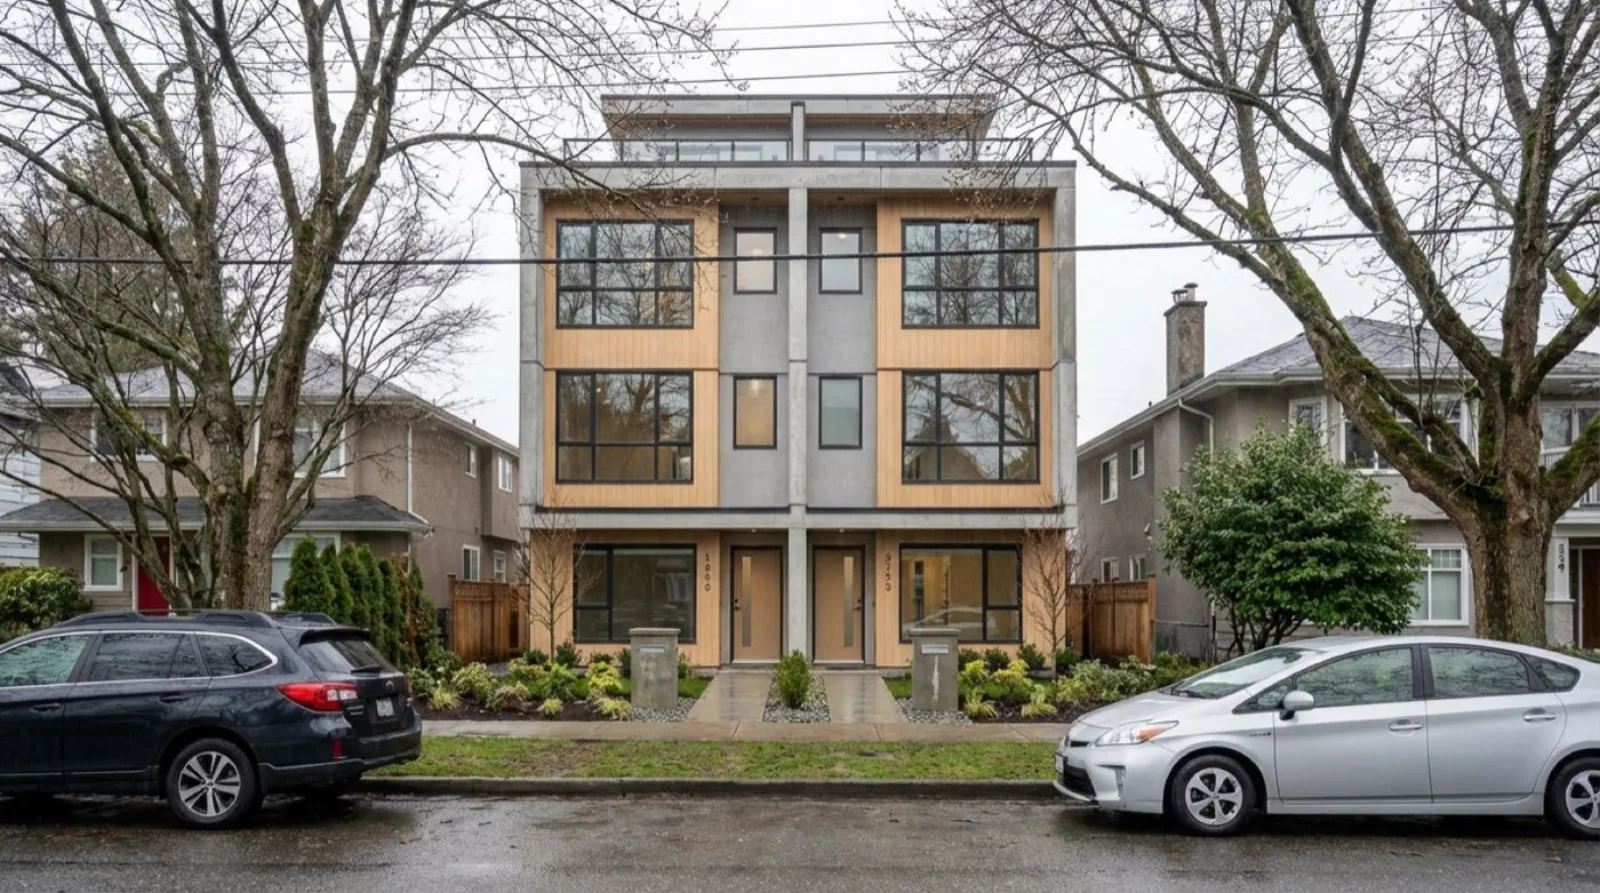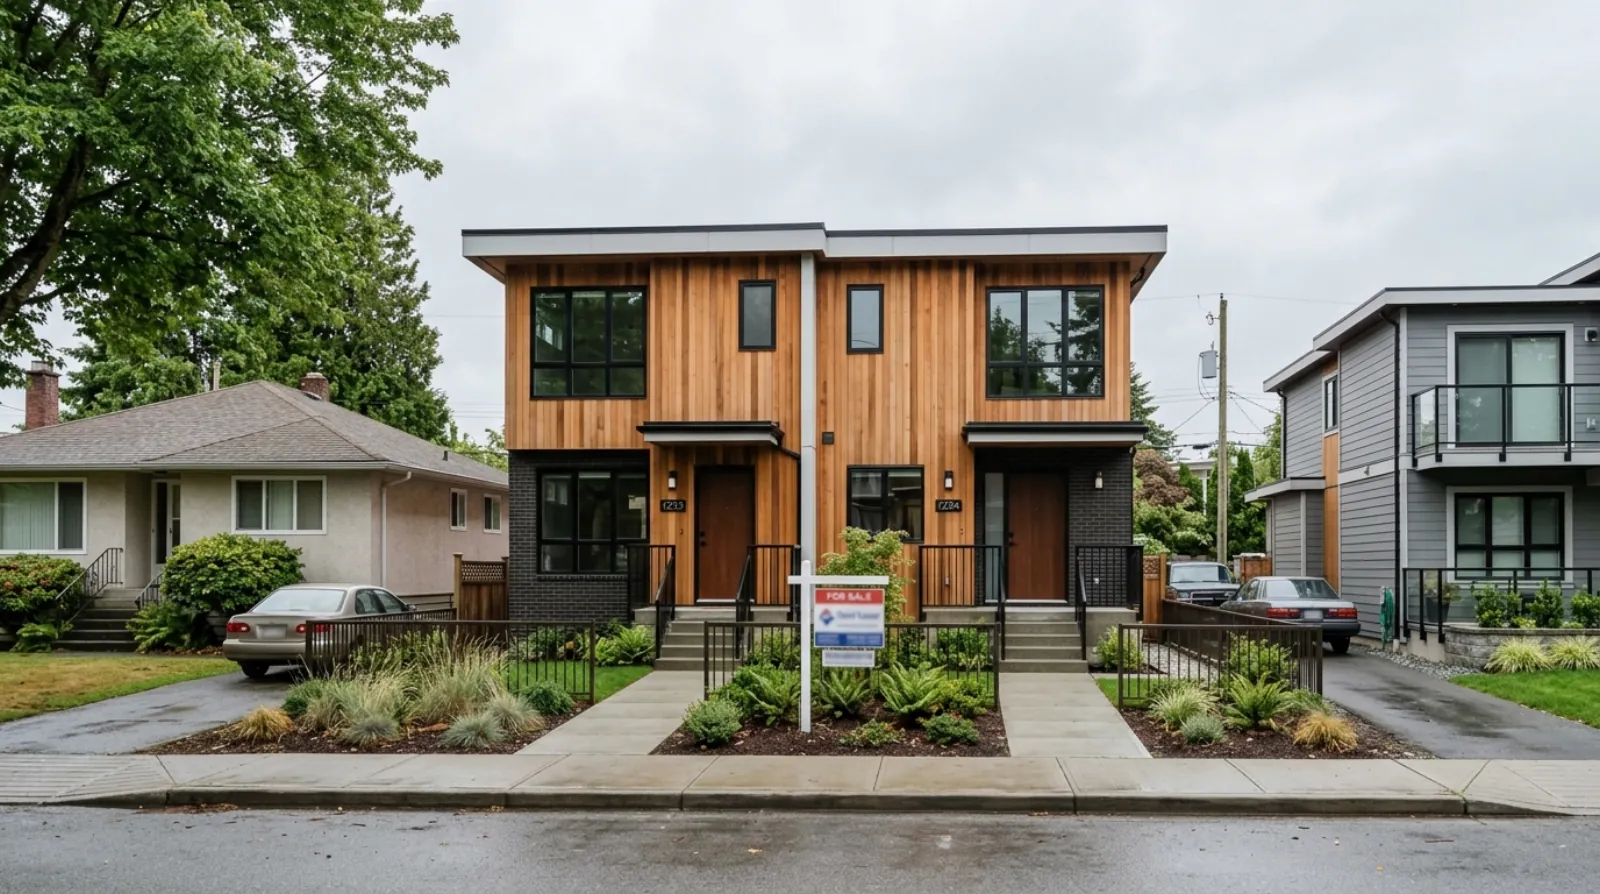

We looked at 37 unit listings across 11 completed Vancouver multiplex projects. On paper, the sold ones moved fast, with a median of 13 days on market. Connect the cancelled and relisted ones, though, and the real market exposure stretched from about 58 to 281 days. That gap is the whole point of this post.
Last week we wrote about capital’s missing middle, the gap between deals too big for one homeowner and too small for institutions. This week, CMHC gave an important update on the market where that development actually happens. It changes what investors should be measuring.
From permission to performance
CMHC’s latest outlook is cautious. It expects weaker home sales, declining prices, and fewer housing starts in 2026. British Columbia and Ontario are expected to stay among the country’s weakest markets, held back by affordability limits, slower population growth, high borrowing costs, and general economic uncertainty.
The national need for housing is still large. The immediate market is still slow. Those two things are true at the same time, and that is exactly the tension a multiplex investor has to underwrite.
So the conversation moves to its next stage: from permission to performance. Bill 44 handed most single-family lots the right to hold three to six homes. That is permission. Performance is whether the homes you build actually sell, at the price you modeled, in a time frame your financing can carry. In a slower market, permission and performance are not the same thing.
What 37 completed multiplex listings actually show
We recently examined 37 publicly traceable unit listings across 11 completed Vancouver multiplex projects. Twenty units had sold. Seventeen were active or had been relisted.
At first glance, the sold properties looked like they moved quickly. Their final MLS® listings showed between 1 and 58 days on market, with a median of 13 days. A median of 13 days sounds like a healthy market.
It was not the whole story.
Several properties had been cancelled, repriced, and relisted, which resets the visible days-on-market count each time. Once the earlier listings were connected to the later ones, completed-project market exposure ranged from roughly 58 to 281 days. For the relisted properties that eventually sold, the reductions from the original asking price ran from about 5% to 12%.
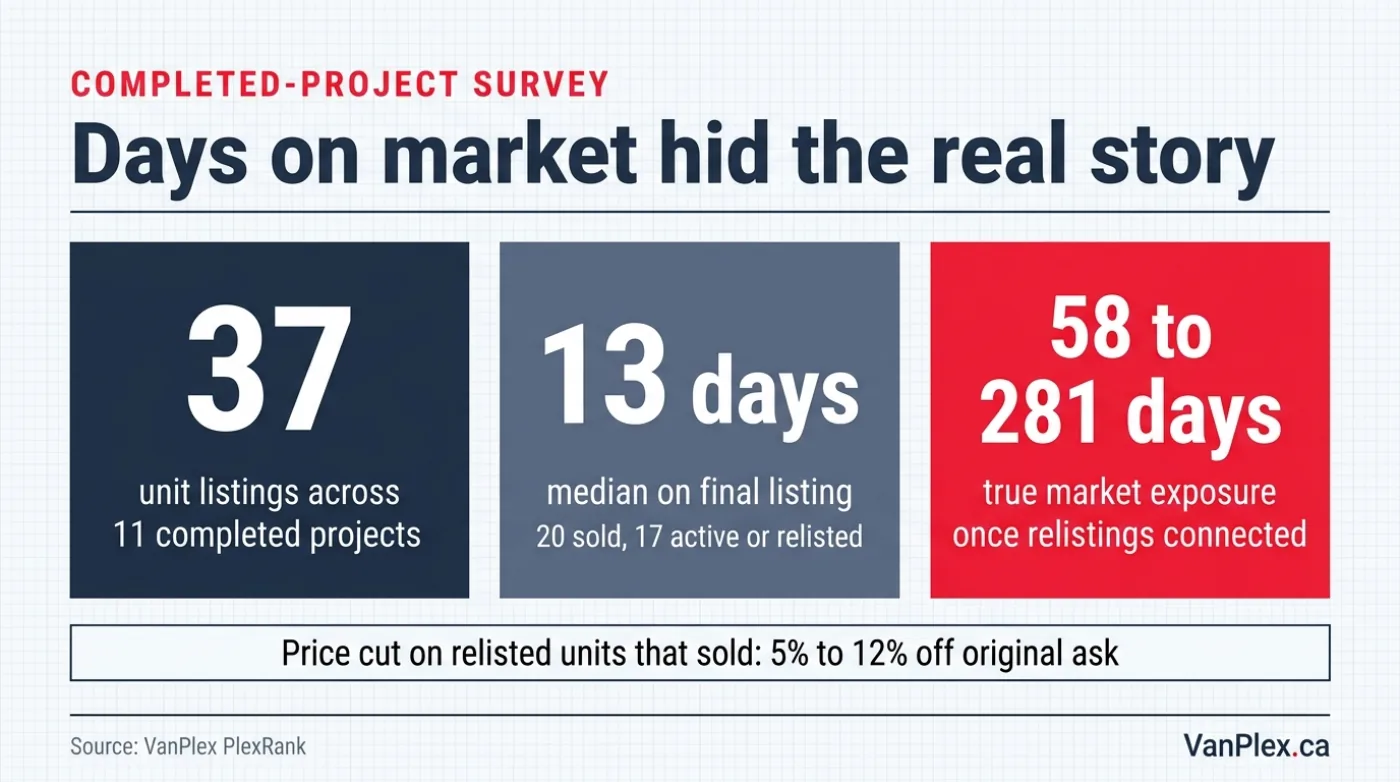
Here is the same survey in one view:
| What we measured | What we found |
|---|---|
| Unit listings examined | 37 across 11 completed projects |
| Sold vs active or relisted | 20 sold, 17 active or relisted |
| Days on market, final listing | 1 to 58 days, median 13 |
| True market exposure (all listing periods) | About 58 to 281 days |
| Price cut on relisted units that sold | About 5% to 12% off original ask |
This is a small, early sample. But it points at something useful. Completed multiplex homes are feeling the same affordability limits and buyer caution as the wider ownership market. Buyers are taking longer to decide, comparing more options, and responding to price changes.
The slow absorption looks tied to the broader economy, not to buyers rejecting multiplex as a category. Families still want ground-oriented homes in established neighbourhoods. They still want extra bedrooms, private entrances, outdoor space, and a short walk to schools and services. What has changed is their ability to pay for them, which is being shaped by mortgage qualification, monthly payments, confidence, and the other homes available at the same price.
For investors, that means absorption now deserves the same attention as zoning, construction cost, and financing.
Absorption belongs in the underwriting
Most multiplex pro formas focus on the expected selling price of each home. The timing of those sales matters just as much.
A sixplex that sells steadily over several months has a very different return than one that sells out shortly after occupancy. Interest, marketing, strata fees, insurance, taxes, and operating costs keep running while finished units sit unsold. A slow sale is not just a delayed win. It is a direct cost.
Our listing survey suggests an investor should look at more than the headline price:
- Total market exposure across every listing period, not just the final one.
- The reduction from the original asking price.
- The pace at which individual units sell inside a project.
- How much competing inventory sits at each price point.
- Carrying costs under a slower sales schedule.
- The return after applying more conservative exit values.
None of this requires a gloomy view of multiplex housing. It requires an accurate view of the market we are in right now.
Same zoning, different outcome
Apply current conditions to individual properties and the effect gets sharper. Across PlexRank™ reports, fairly small changes in resale values, land cost, financing rates, and project timelines can move projected return by a lot.
A project with a thin margin can drop below an investor’s threshold after a modest cut in expected selling prices. A project with a stronger land basis, efficient buildable area, a well-matched unit mix, and defensible neighbourhood values holds up far better.
That widens the performance gap between properties that share the same zoning. Two neighbouring lots may both allow six homes, and still end up with entirely different financial outcomes.
- One may carry too much land cost for the sellable area it creates.
- One may produce units priced above the strongest pool of local buyers.
- One may need a long approval or construction period that piles on carrying cost.
- Another may combine a good purchase price, efficient design, and an attainable end product that carries the investment through a softer market.
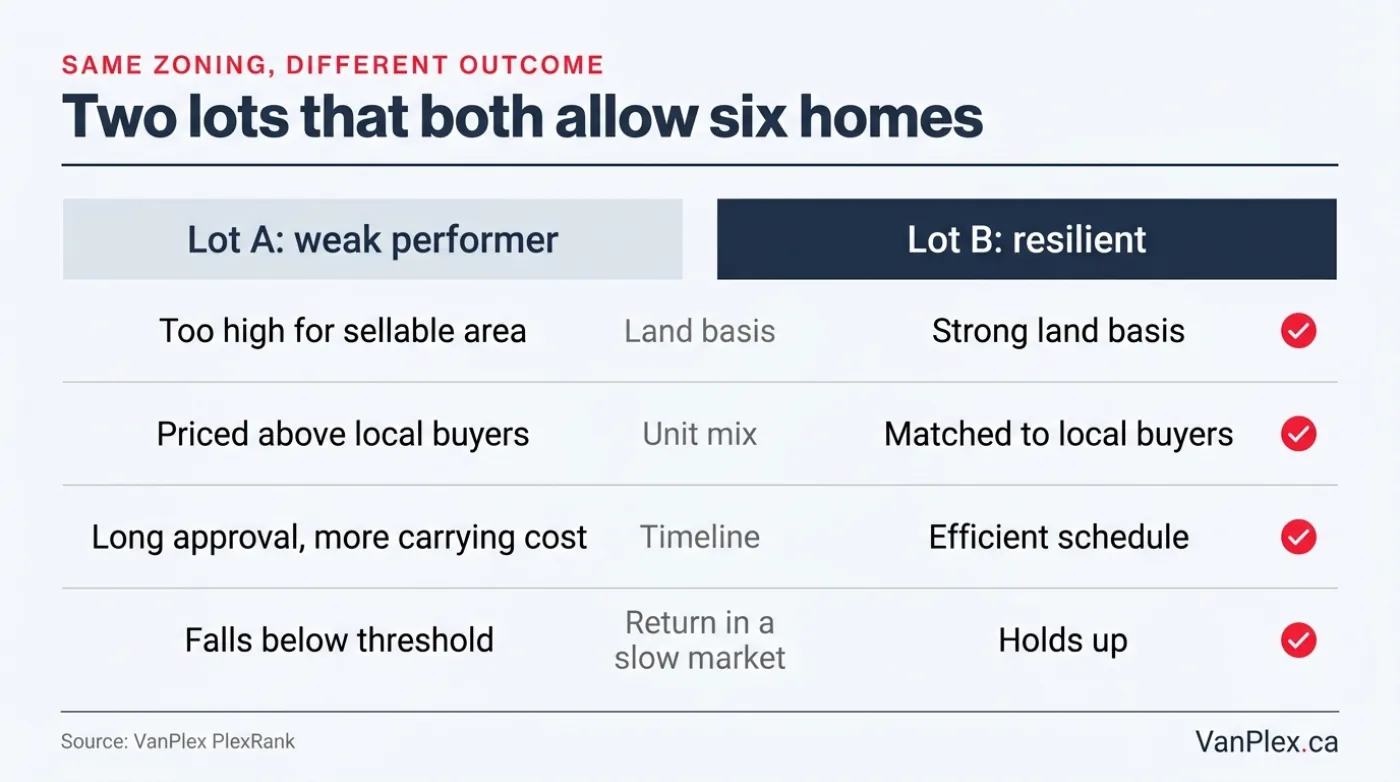
PlexRank™ lets these differences be seen before serious capital is committed. That matters more, not less, as the market slows down. It is the same discipline we wrote about when we argued multiplex should be treated as an asset class, not a one-off project.
The standard for the next opportunity
As we prepare a specific multiplex investment opportunity, we are applying this evidence directly.
The underwriting has to reflect current absorption. The projected values have to be supported by the homes buyers are actually purchasing today. The capital structure has to allow for a realistic sales period. And the return has to stay worthwhile after testing lower exit prices, higher carrying costs, and schedule delays.
A strong base-case pro forma is where the analysis starts. The downside cases are where the quality of the opportunity shows up. That is how a newly permitted housing form turns into an investable category:
Zoning opens a field of possible projects. Parcel-level intelligence ranks that field. Market evidence shapes the assumptions. Disciplined underwriting finds the relatively small number of properties that can actually perform.
Investor Intelligence Principle #3
In a slower housing market, underwriting must measure both value and absorption. PlexRank™ identifies how current prices, sales timelines, and project costs affect the performance of each individual property.

Common questions from investors
Does CMHC’s forecast mean multiplex is a bad investment right now? No. It means the market is slower, so the margin for error is thinner. CMHC’s Summer 2026 outlook expects weaker sales, softer prices, and fewer starts, with BC among the weakest markets. Families still want ground-oriented homes. The job is to underwrite for the market we have, not the one from two years ago.
What is absorption, and why does it matter so much? Absorption is how quickly finished units actually sell. It matters because carrying costs (interest, taxes, insurance, strata, marketing) keep running until the last unit closes. A project that takes several months to sell out earns a very different return than one that clears quickly, even at the same prices.
Why did the days-on-market number understate the real picture? Because a property that is cancelled and relisted starts a fresh days-on-market count. The final listing for our sold units showed a median of 13 days, but once the earlier listing periods were connected, true market exposure ran from about 58 to 281 days.
If two lots have the same zoning, why would returns differ? Zoning only sets how many homes are allowed. Land basis, buildable area, unit mix, neighbourhood values, timeline, and financing decide the return. In a slower market those differences get larger, which is what PlexRank™ is built to measure before you commit capital.
Zoning opened the field. A slower market decides who was actually paying attention. Check whether your lot clears the first screen, then underwrite it for the market we are in, not the one we left.
By David Babakaiff, Co-Founder, VanPlex | PlexRank™ | Profit with Multiplex